

Summary
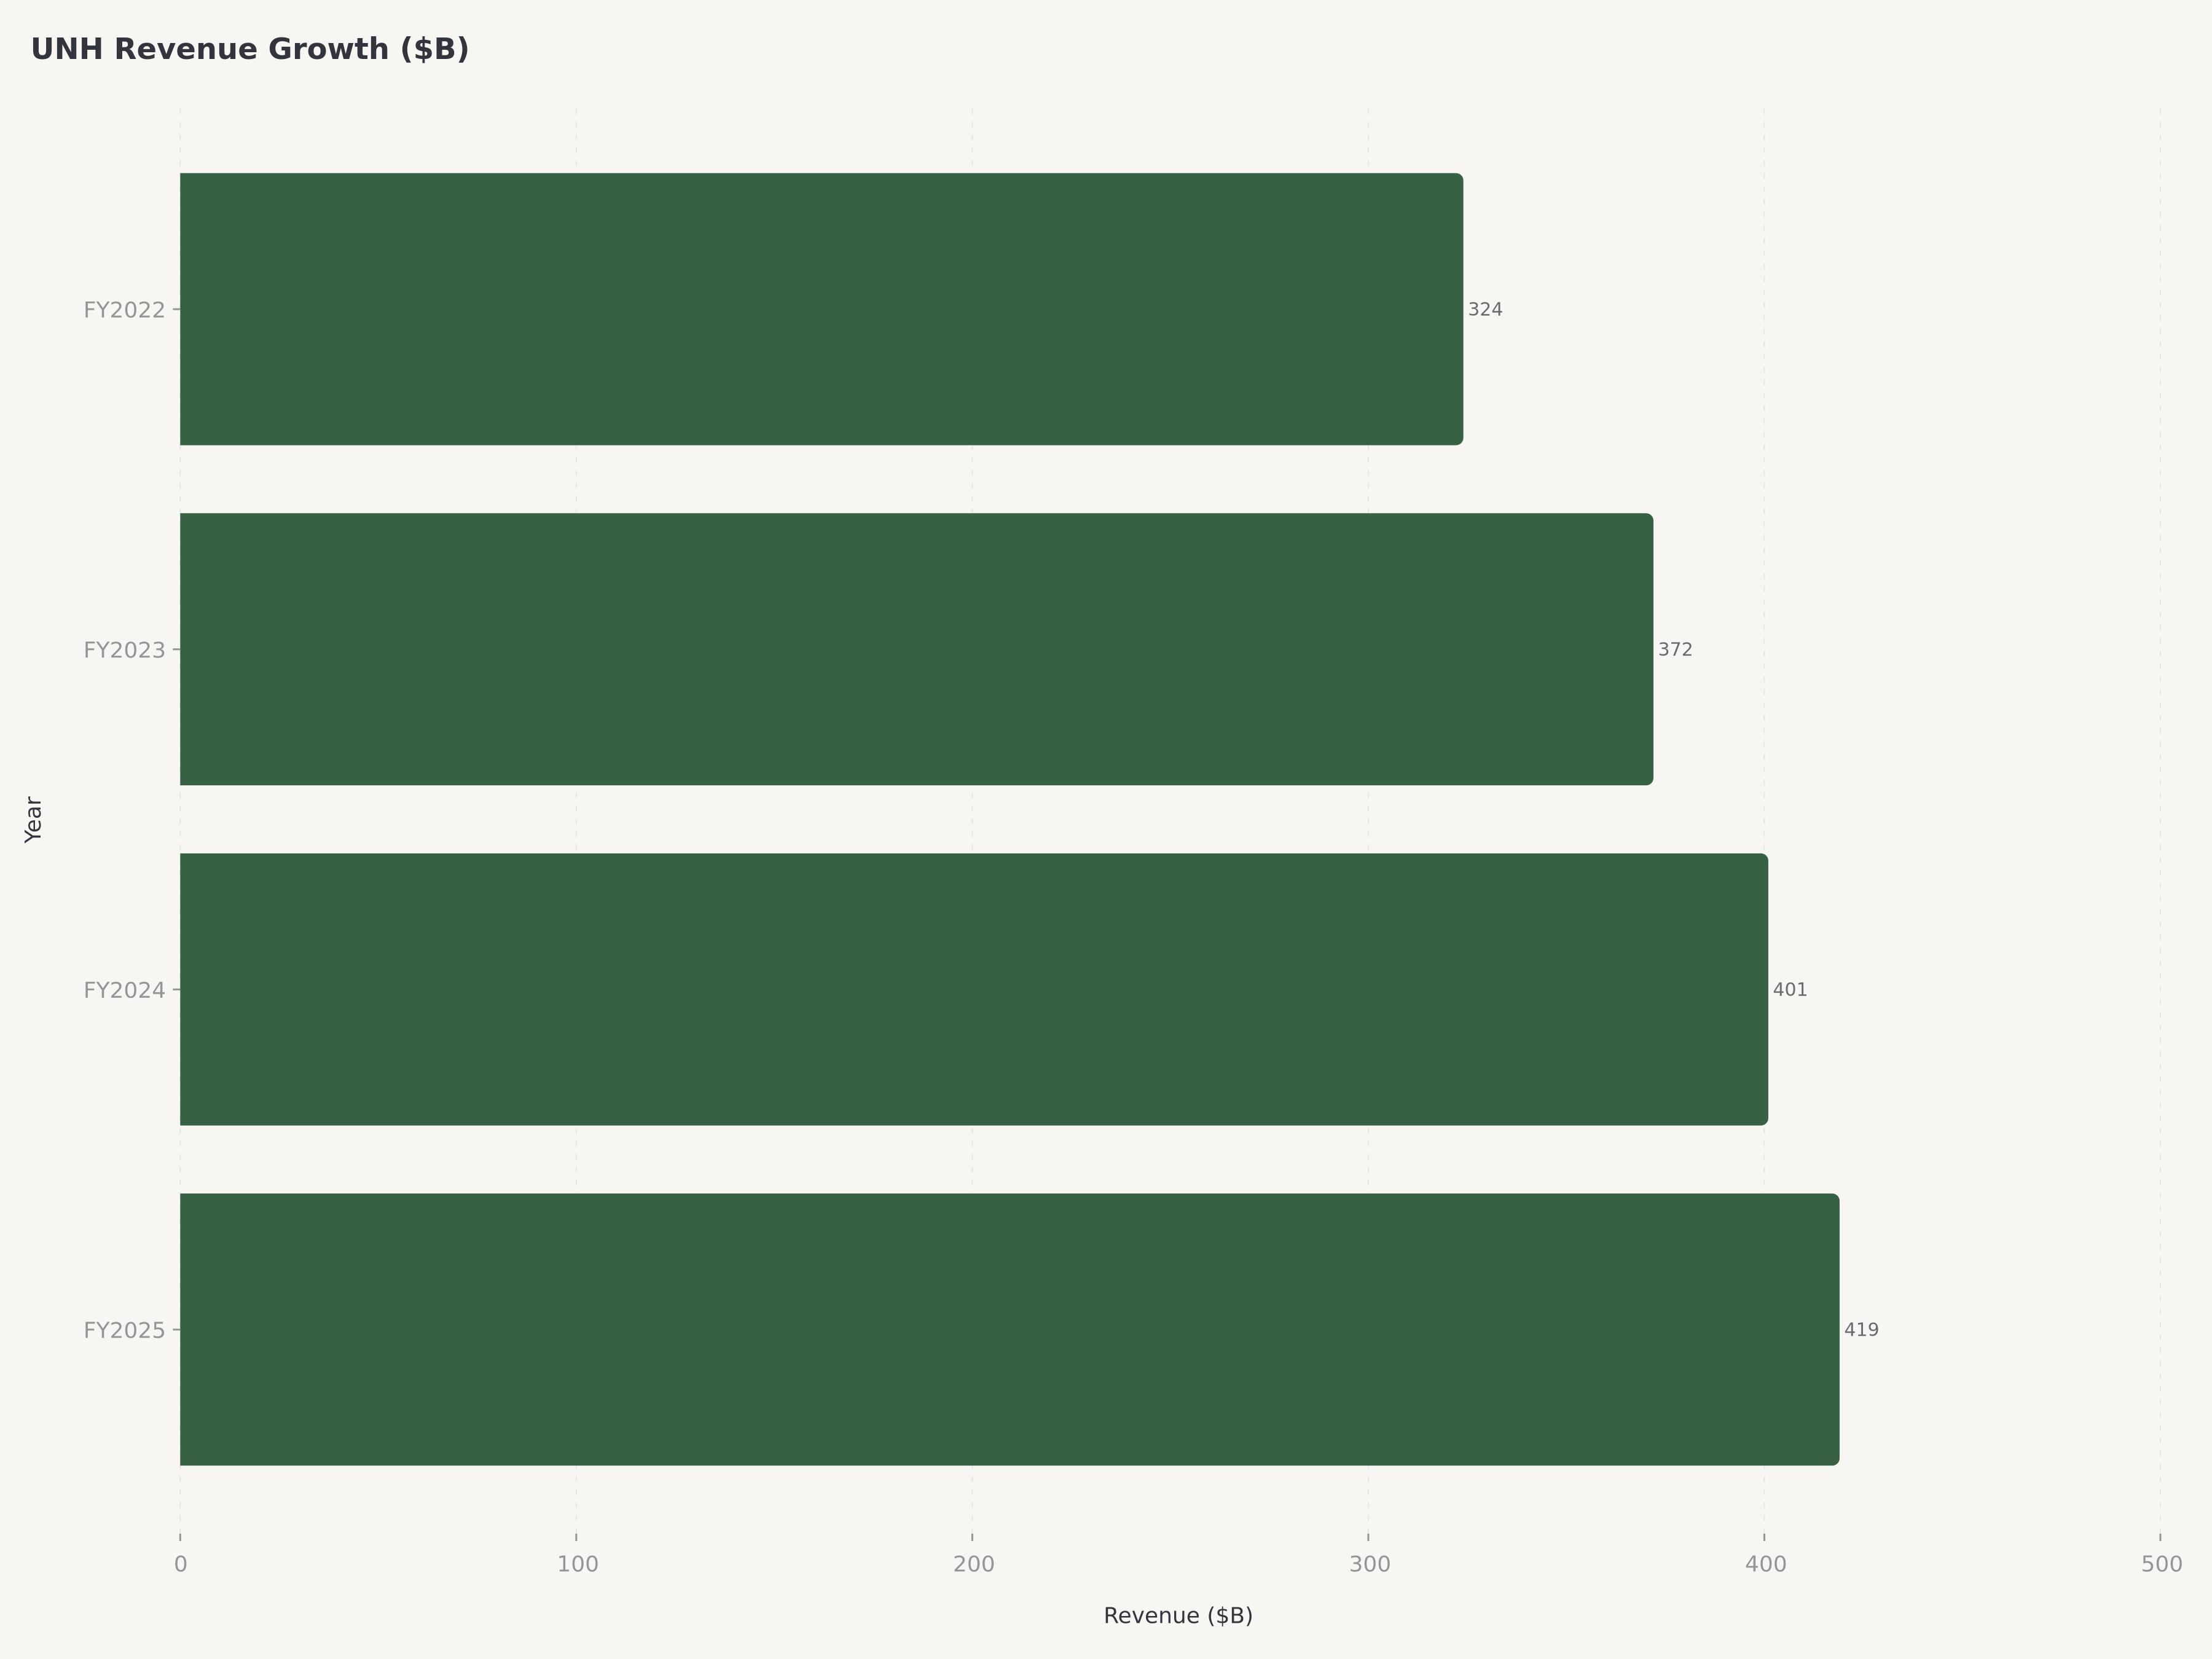
- Revenue & scale: FY2025 revenue reached $419.3 billion (+12% YoY), cementing UnitedHealth Group as the largest company by revenue in the U.S. healthcare system. The Optum platform — spanning health services, technology, and pharmacy benefits — has become the primary growth engine, with Optum Rx posting the fastest expansion across the enterprise.
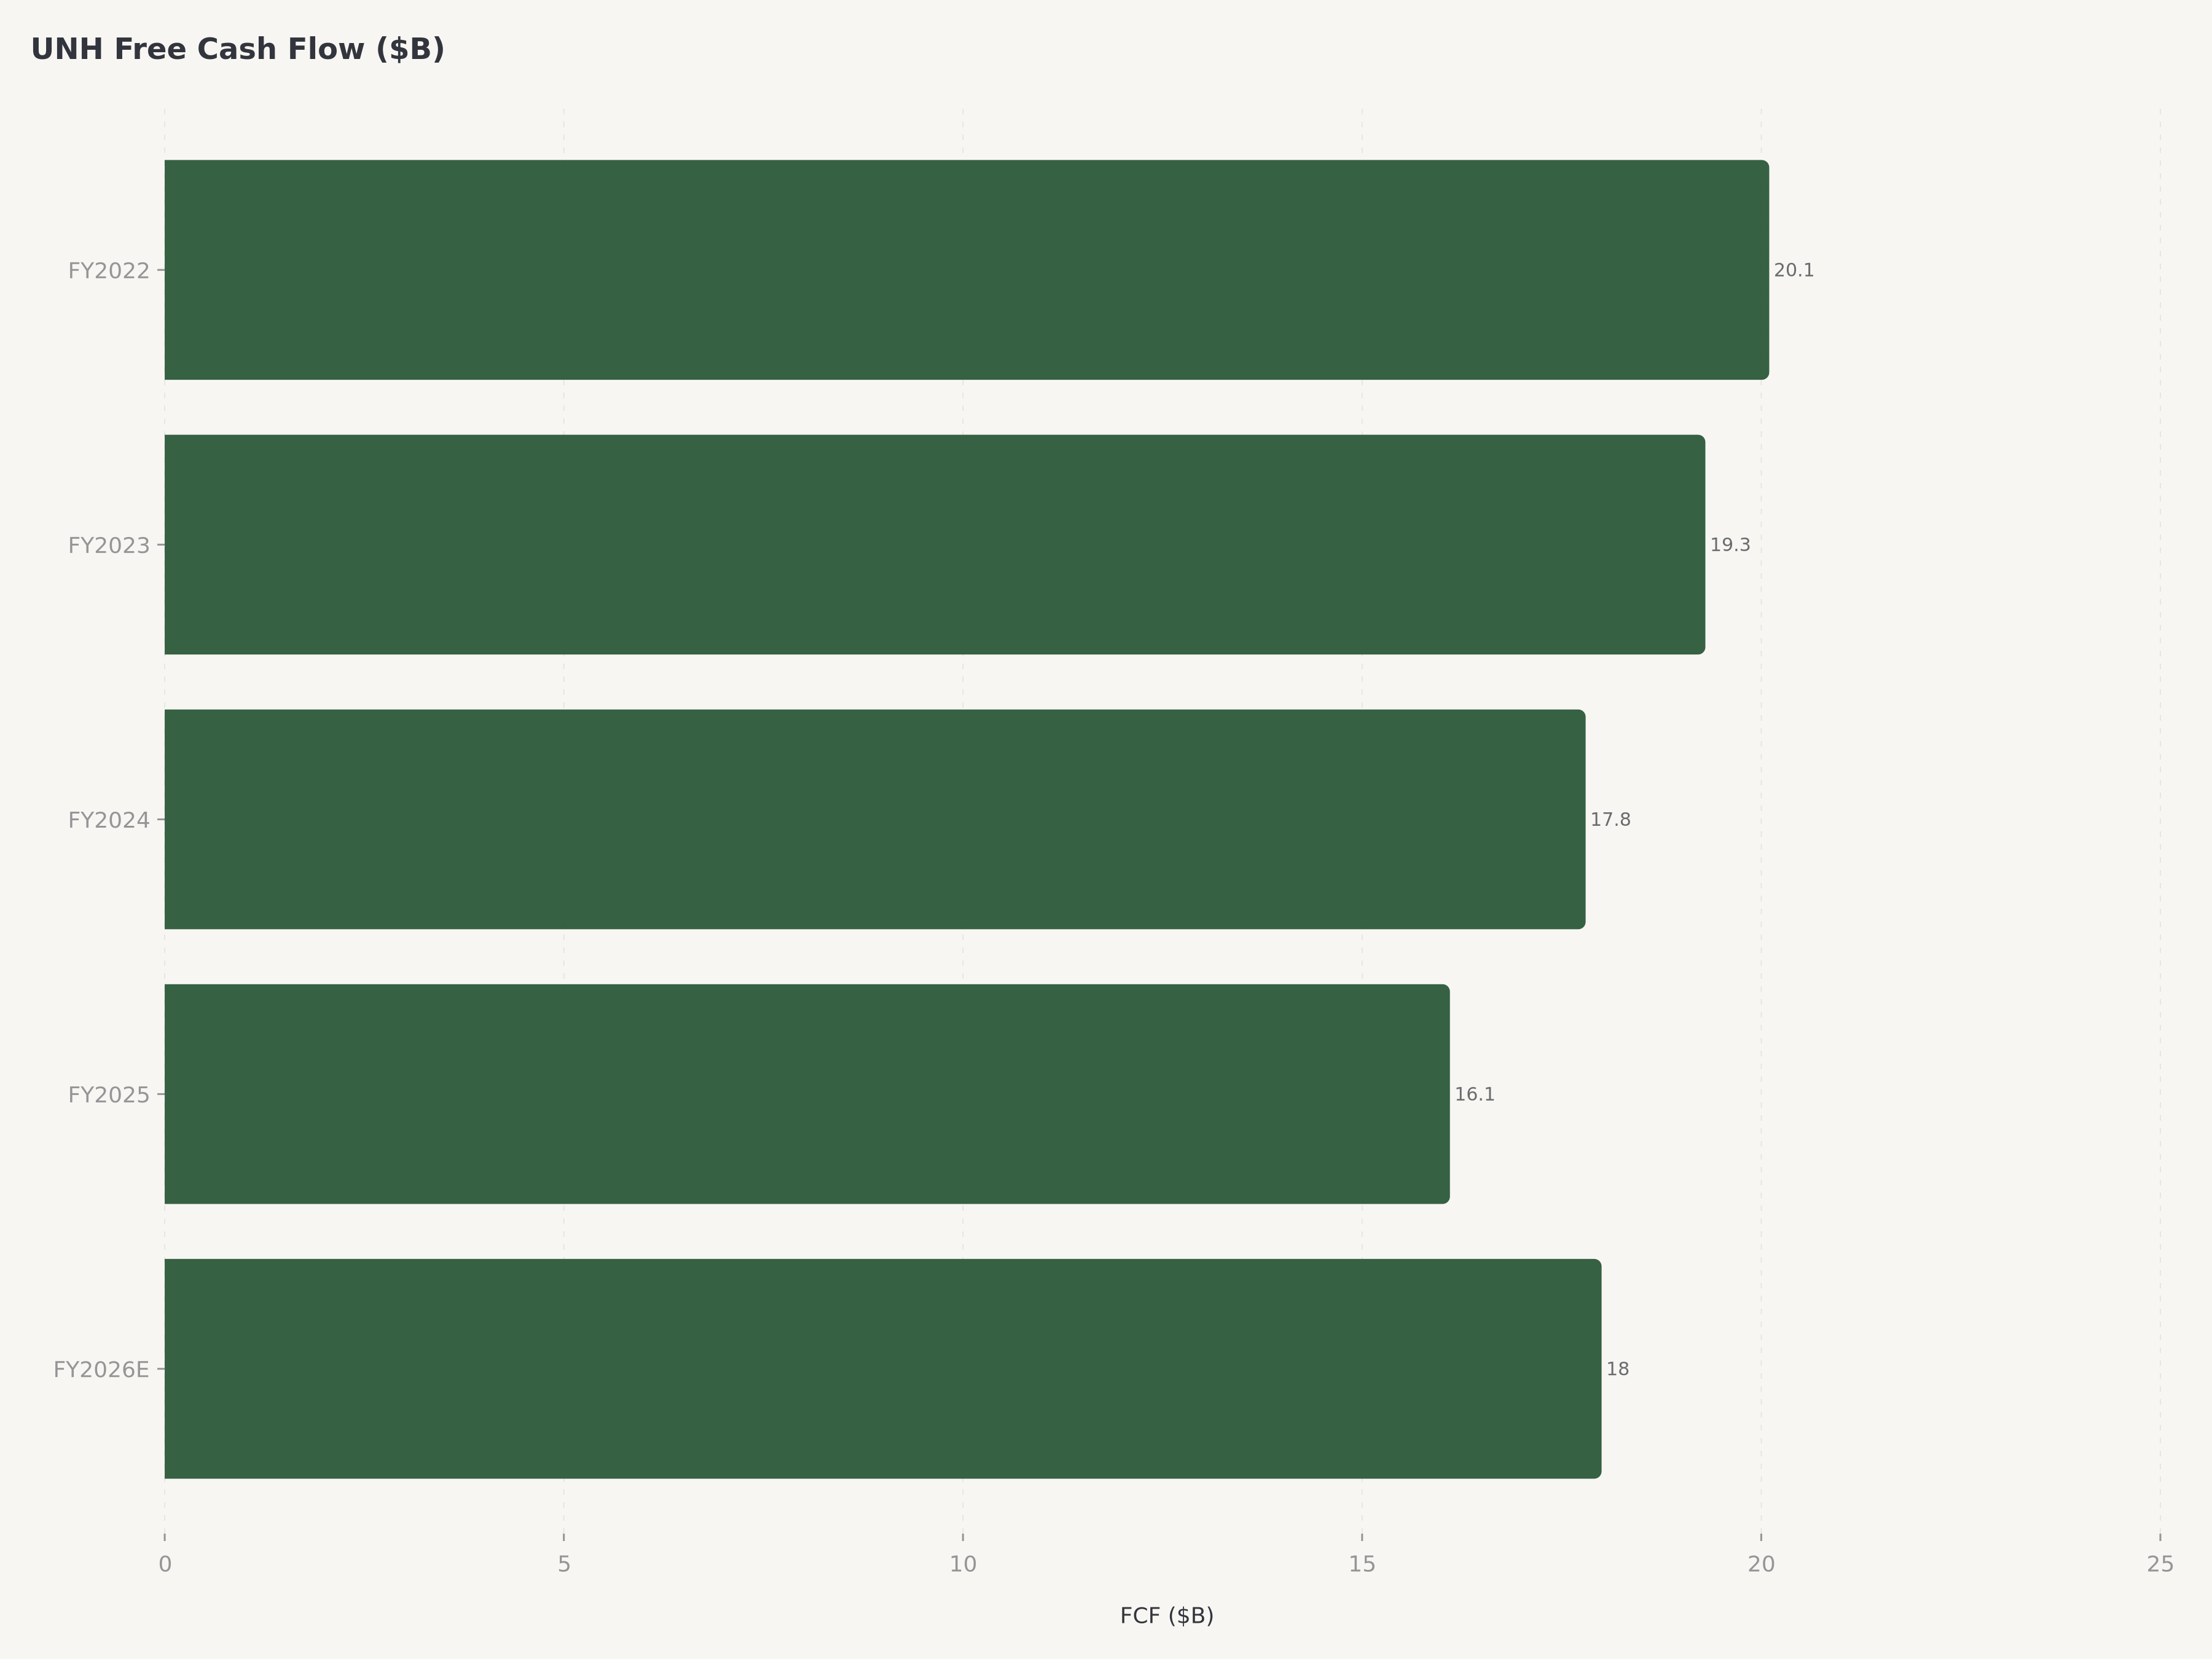
- Profitability & cash flow: GAAP EPS of $21.11 and Non-GAAP EPS of $21.00 reflect stable earnings power despite a strategically deliberate reduction of 2.8 million memberships. Management has guided free cash flow to approximately $18 billion for FY2026, underpinning the quarterly dividend of $2.21 per share and ongoing capital return capacity.
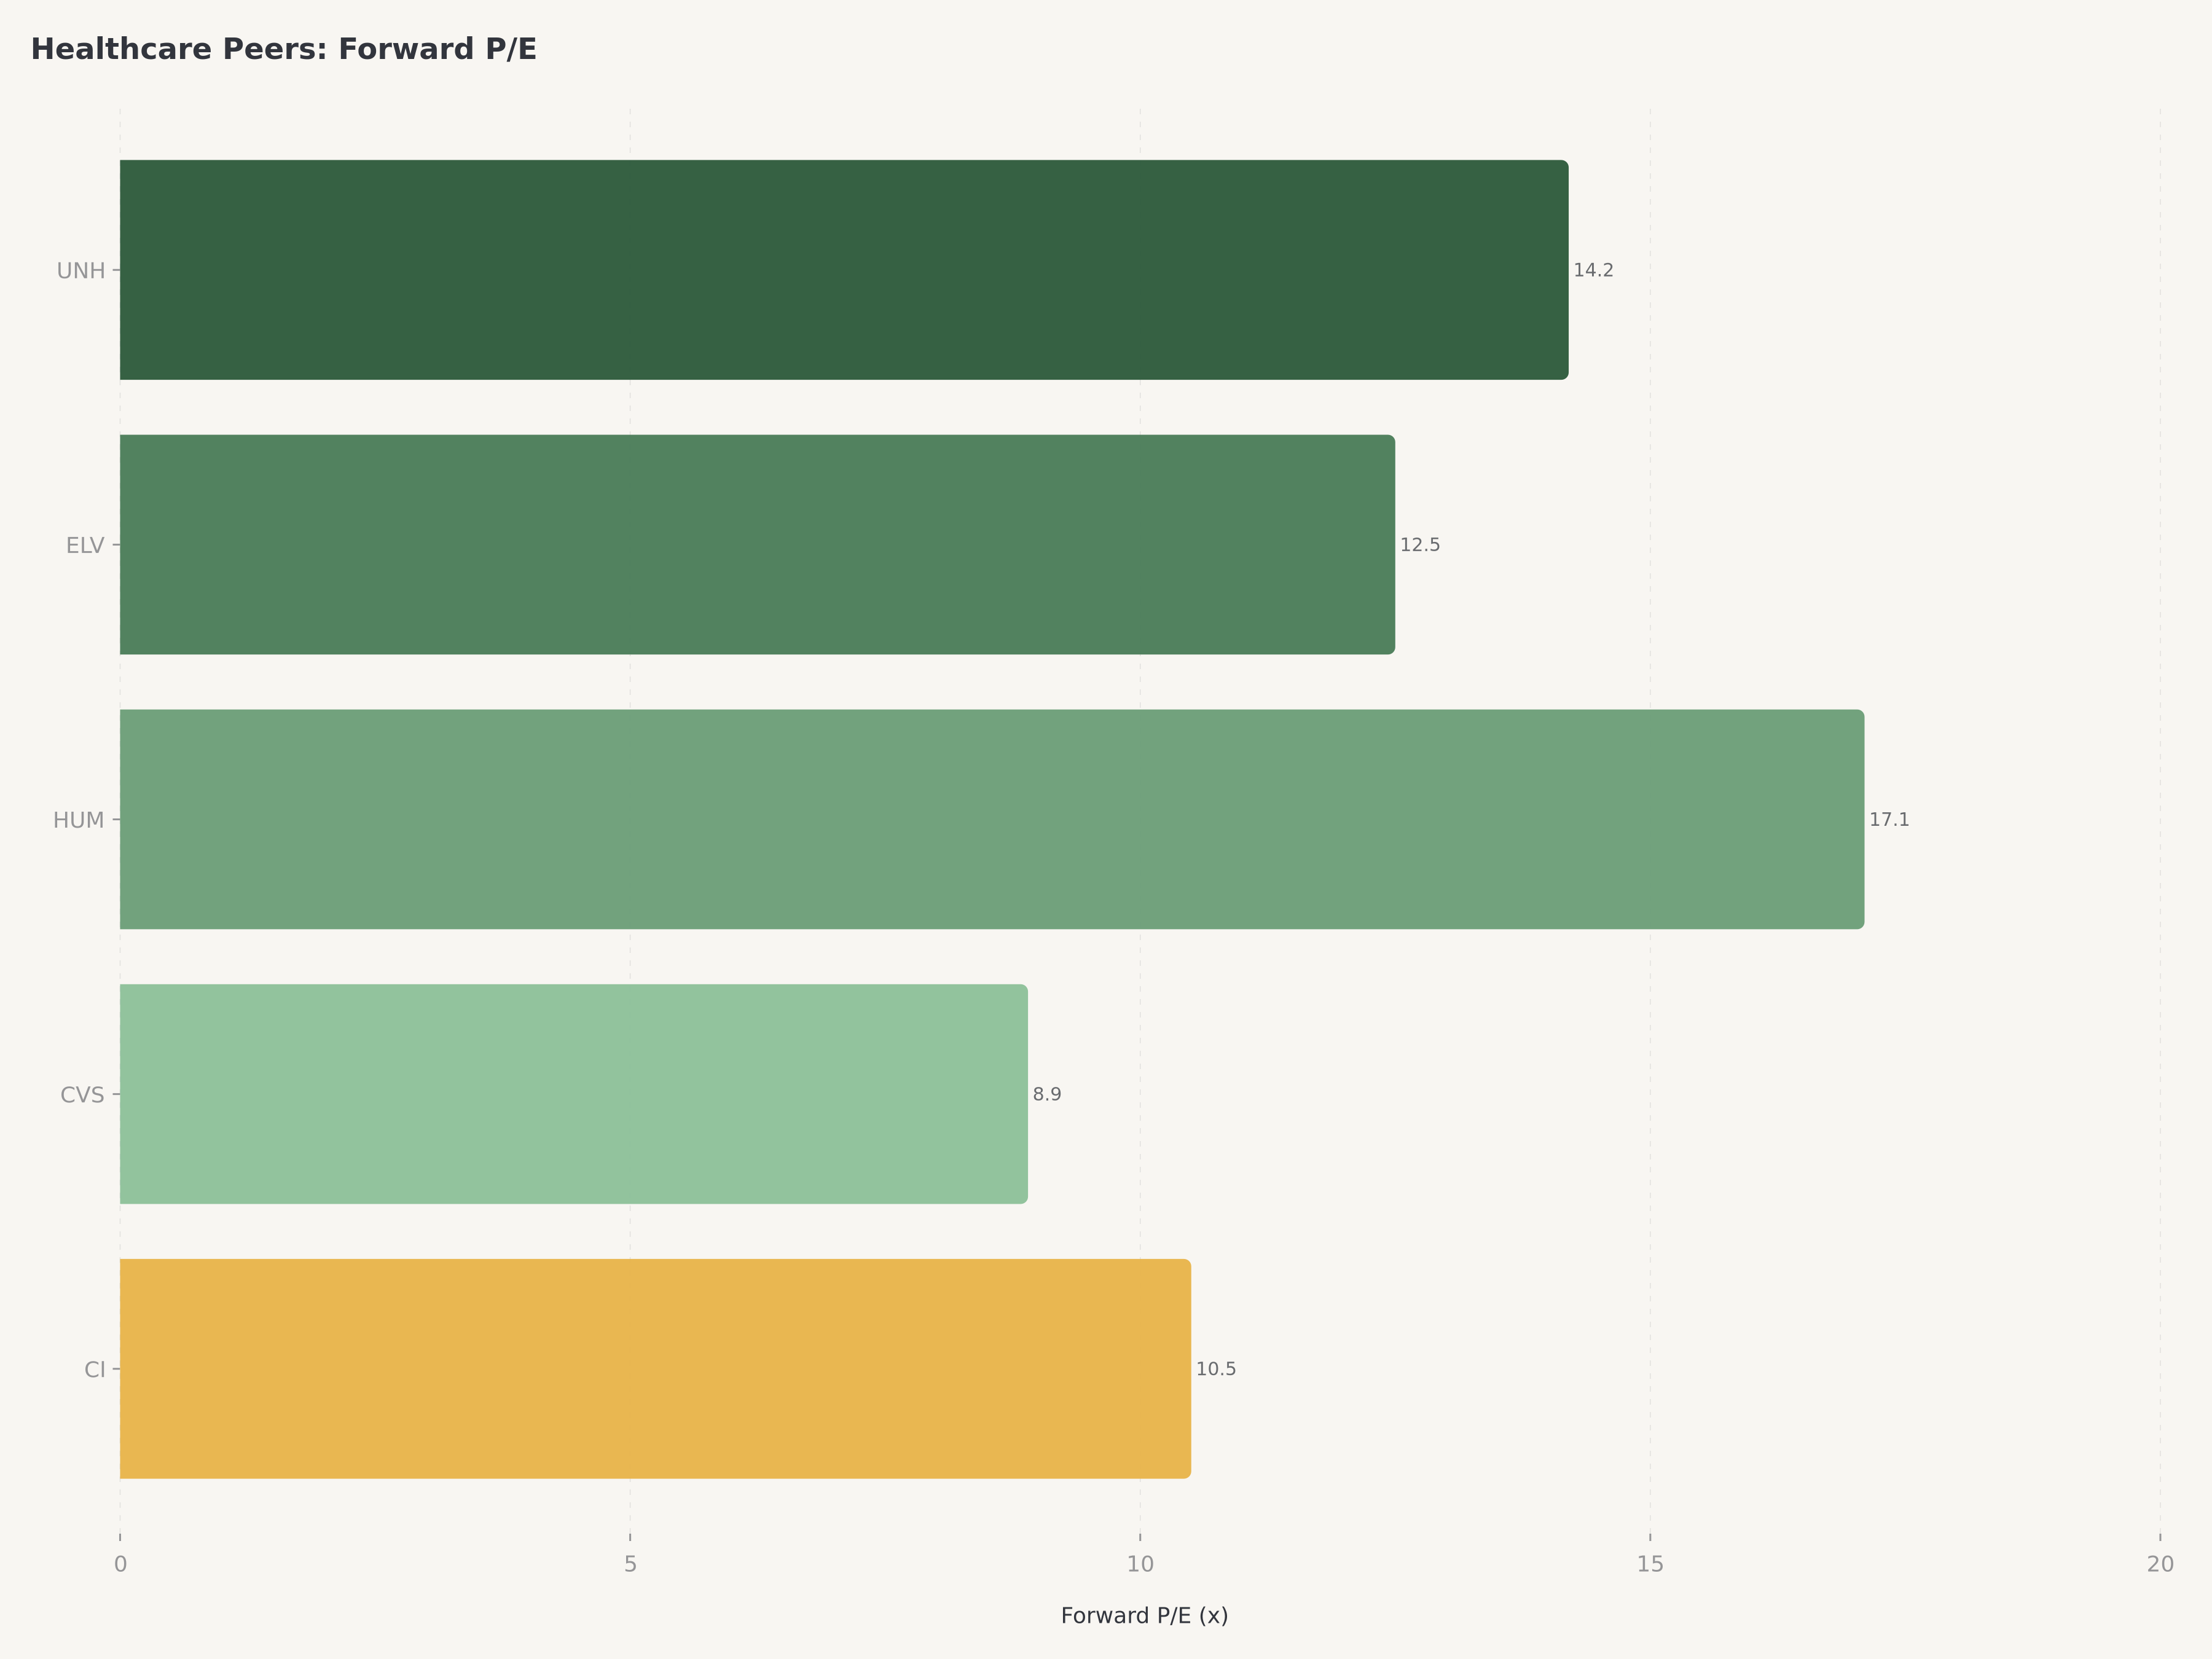
- Valuation & catalyst: At a forward P/E of approximately 14.2x, UNH trades at a meaningful discount to its five-year average despite structurally improving margins at Optum. Q1 2026 earnings release today (April 21) serves as the near-term catalyst. Our $330 price target implies approximately 20% upside, supported by Optum's secular growth trajectory and disciplined Medical Loss Ratio management.
Macro Context: The U.S. Healthcare Landscape in 2026
The United States healthcare system consumes approximately $4.8 trillion annually, representing roughly 17.5 percent of gross domestic product — a proportion that continues its multi-decade upward trajectory driven by an aging population, chronic disease prevalence, and pharmaceutical innovation. For managed care organizations, this spending growth creates a durable revenue tailwind that few other sectors can match. The Centers for Medicare and Medicaid Services projects national health expenditure growth of 5 to 6 percent annually through the end of the decade, outpacing nominal GDP growth and ensuring that the underlying volume of insured lives and medical transactions continues to expand.
The policy environment in 2026 presents a mixed backdrop. Medicare Advantage enrollment has surpassed 33 million beneficiaries, representing over half of all Medicare-eligible individuals — a penetration rate that seemed aspirational just five years ago. This secular shift benefits large managed care operators who can amortize care coordination investments across massive member pools. However, regulatory scrutiny has intensified. The Centers for Medicare and Medicaid Services finalized risk adjustment methodology changes that reduce the coding intensity benefit that MA plans had historically captured, creating a headwind to per-member revenue growth that requires operational discipline to offset.
On the pharmacy front, the Inflation Reduction Act's drug pricing provisions are reshaping the pharmaceutical value chain. Medicare Part D redesign, which caps out-of-pocket costs for beneficiaries, shifts financial liability upstream to plans and pharmacy benefit managers. For vertically integrated operators like UnitedHealth Group, this creates both challenge and opportunity: the PBM must absorb greater cost exposure, but the integrated model allows for internal optimization across insurance, pharmacy, and care delivery that standalone PBMs cannot replicate.
The labor market for healthcare professionals remains structurally tight. Physician shortages, particularly in primary care, have accelerated the shift toward value-based care arrangements that compensate providers for outcomes rather than volume. This transition plays directly to the strengths of data-rich, technology-enabled platforms — precisely the capability that Optum has spent a decade building.
The UnitedHealth Transformation: From Insurer to Health System
UnitedHealth Group's evolution over the past decade represents one of the most consequential strategic pivots in American corporate history. What began as a traditional health insurance company has transformed into a vertically integrated health services conglomerate that touches nearly every element of the care delivery and financing ecosystem. The architect of this transformation was the late Andrew Witty, but the strategic blueprint endures under Stephen Hemsley, who returned as CEO in May 2025 — bringing back the executive who originally built the Optum vision during his prior tenure from 2006 to 2017.
Hemsley's return signals a renewed emphasis on operational execution and capital discipline. His first major strategic decision — the deliberate reduction of approximately 2.8 million memberships — initially unnerved the market but reveals a sophisticated understanding of insurance economics. By exiting unprofitable or marginally profitable membership cohorts, particularly in certain state Medicaid contracts and individual exchange plans with adverse risk selection, UnitedHealth is prioritizing margin quality over revenue volume. This is the playbook Hemsley pioneered in his first tenure: grow where the unit economics are favorable, retreat where they are not, and let the Optum platform create value that transcends insurance underwriting.
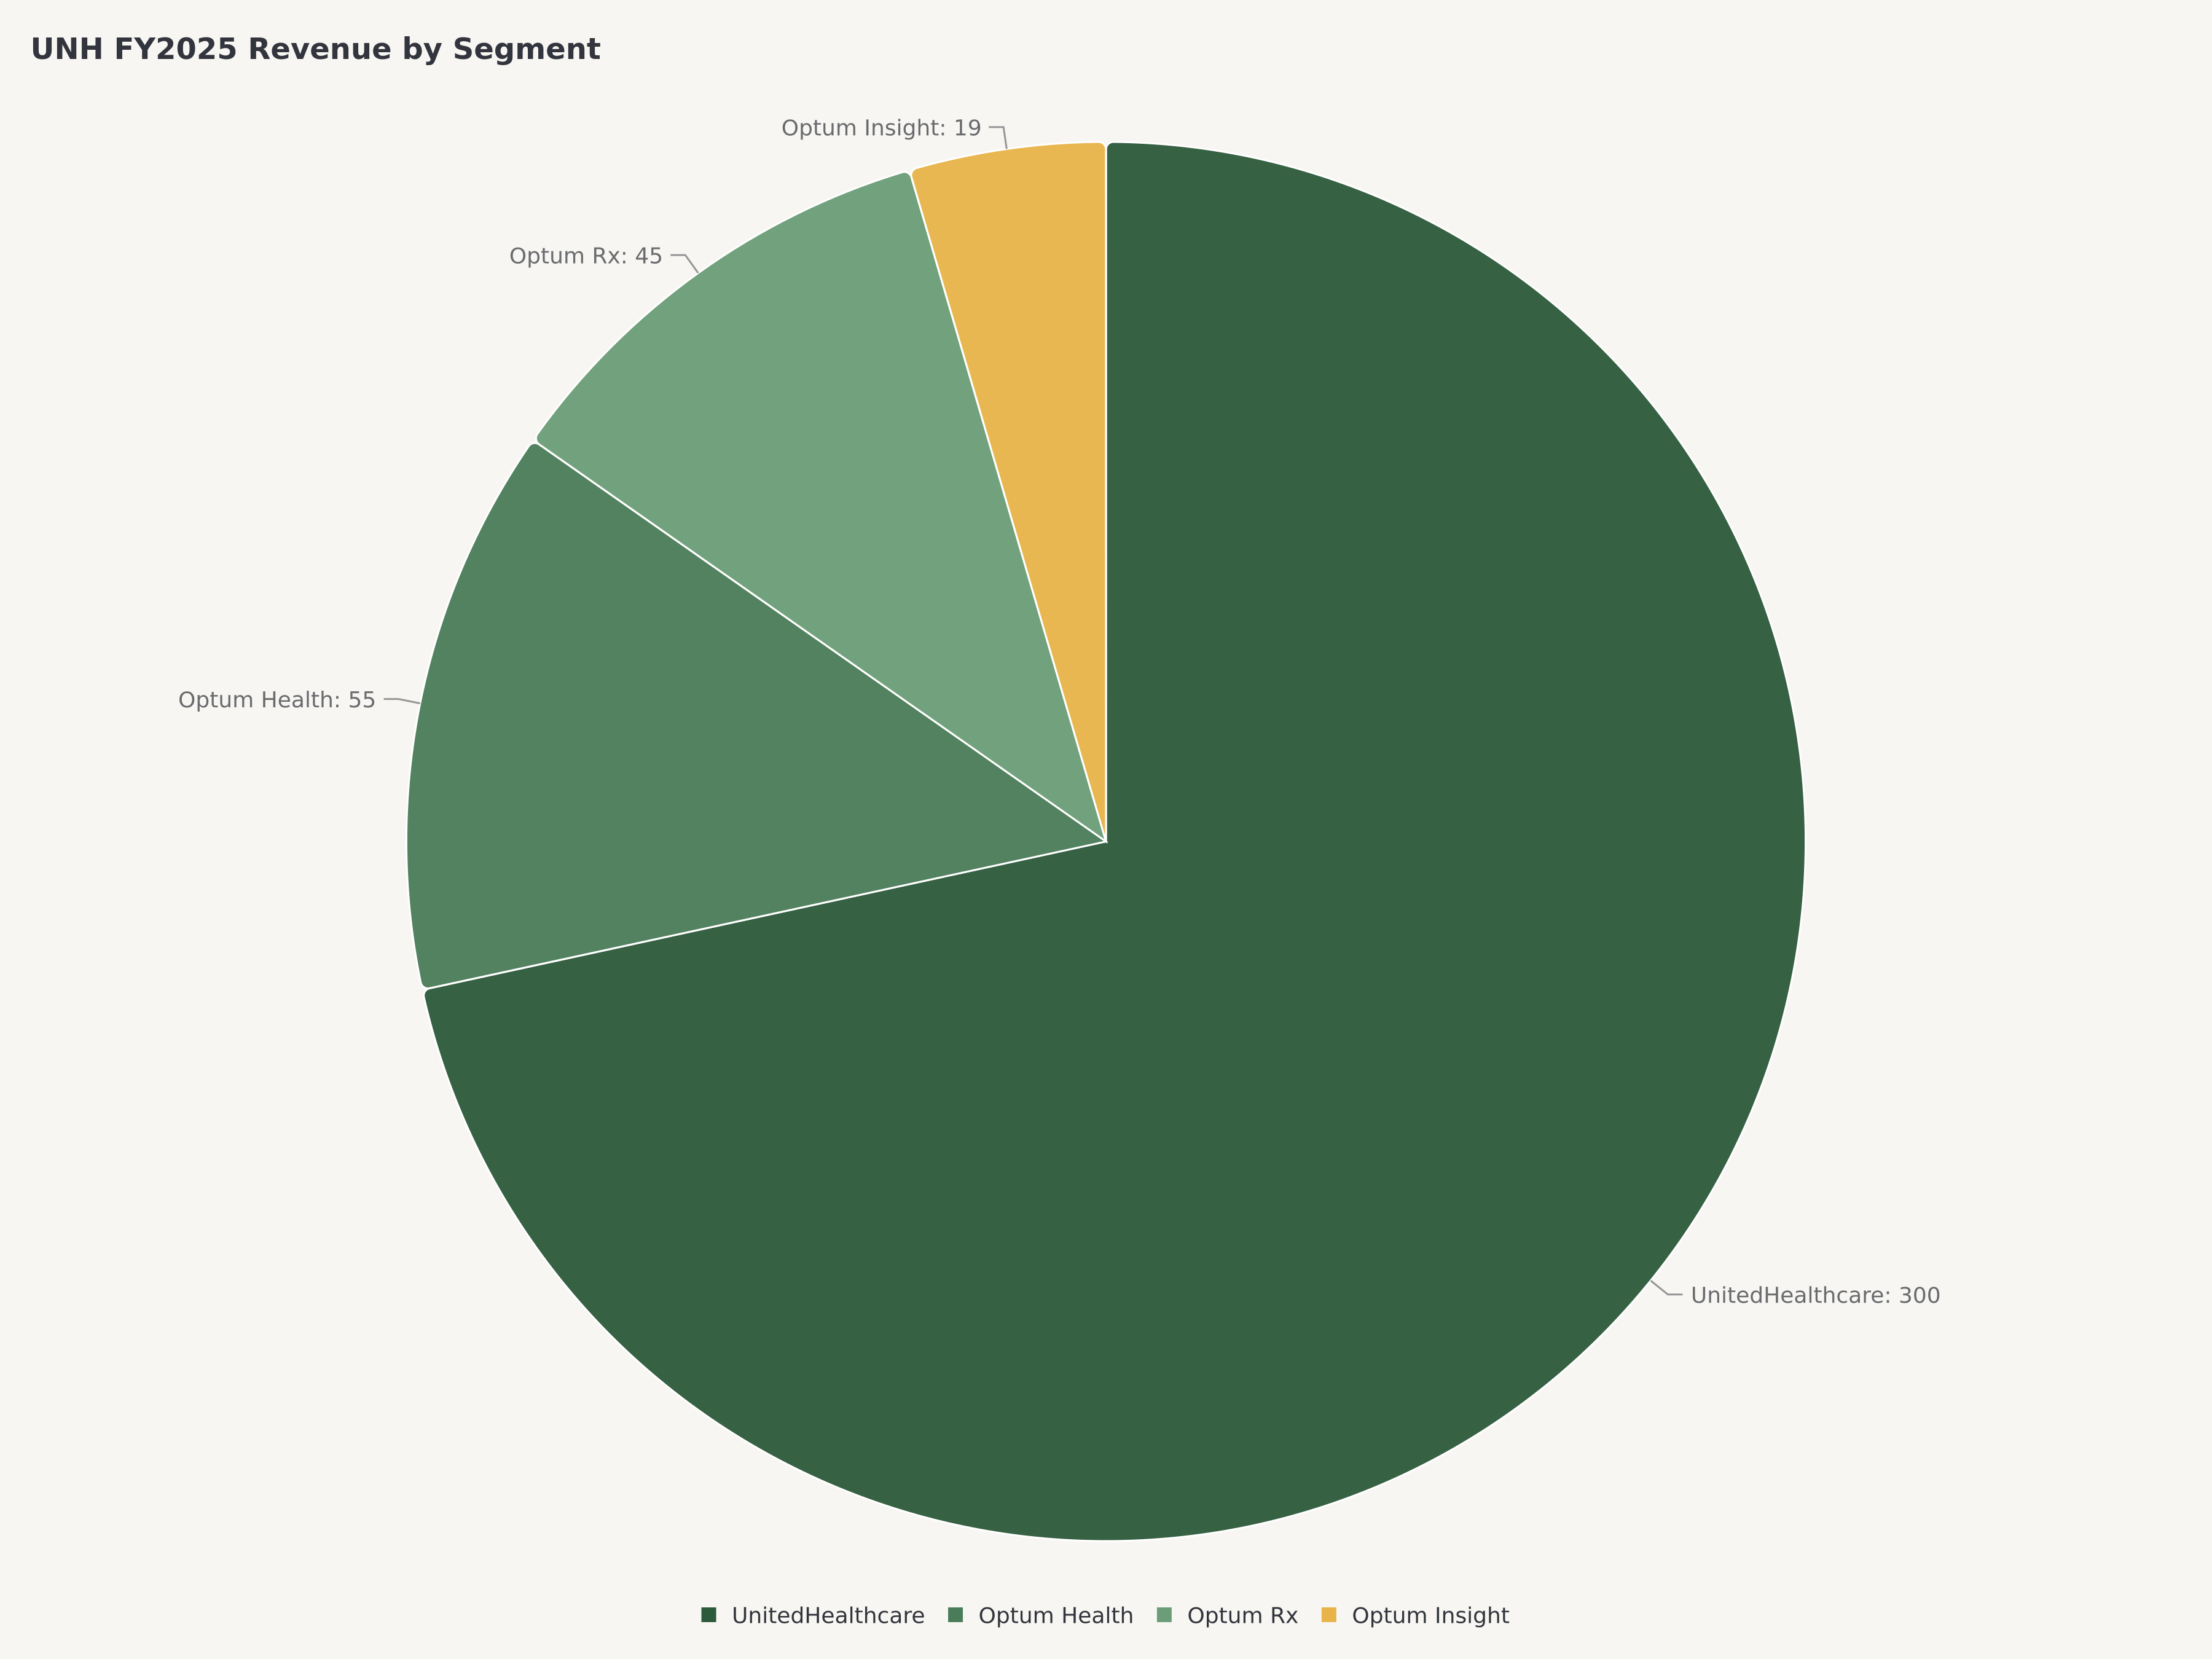
The organizational structure reflects this dual identity. UnitedHealthcare, the insurance arm, provides the distribution and member access layer — covering approximately 50 million medical members across employer-sponsored, individual, Medicare Advantage, and Medicaid lines of business. Optum, the health services conglomerate, comprises three interconnected platforms: Optum Health (care delivery and value-based care with over 100,000 aligned physicians), Optum Insight (health technology, analytics, and revenue cycle management), and Optum Rx (one of the nation's three largest pharmacy benefit managers, processing over 1.4 billion adjusted scripts annually).
The strategic genius lies in the flywheel between these entities. UnitedHealthcare members receive care through Optum Health physicians, whose outcomes data flows through Optum Insight's analytics platform, with prescriptions fulfilled by Optum Rx's pharmacy network. Each transaction generates data that improves risk prediction, care protocols, and cost management — competitive advantages that compound over time and are extraordinarily difficult for less integrated competitors to replicate.
Operating Performance: FY2025 Delivers Scale and Discipline
UnitedHealth Group's FY2025 financial results demonstrated the earnings resilience of the integrated model even during a period of deliberate strategic rebalancing. Total revenue of $419.3 billion represented a 12 percent year-over-year increase, a remarkable growth rate for a company that already constituted the largest revenue generator in the U.S. healthcare sector. To contextualize this scale: UNH's annual revenue exceeds the GDP of many developed nations and is roughly equivalent to the entire revenue of the U.S. commercial banking industry's top five players combined.
GAAP earnings per share of $21.11 and Non-GAAP EPS of $21.00 reflected the narrow gap between reported and adjusted earnings that characterizes a mature, well-managed business with limited one-time distortions. The minimal GAAP-to-Non-GAAP divergence of approximately $0.11 is itself a quality indicator — it suggests management is not relying on aggressive adjustments to present a materially different earnings picture than GAAP accounting requires.
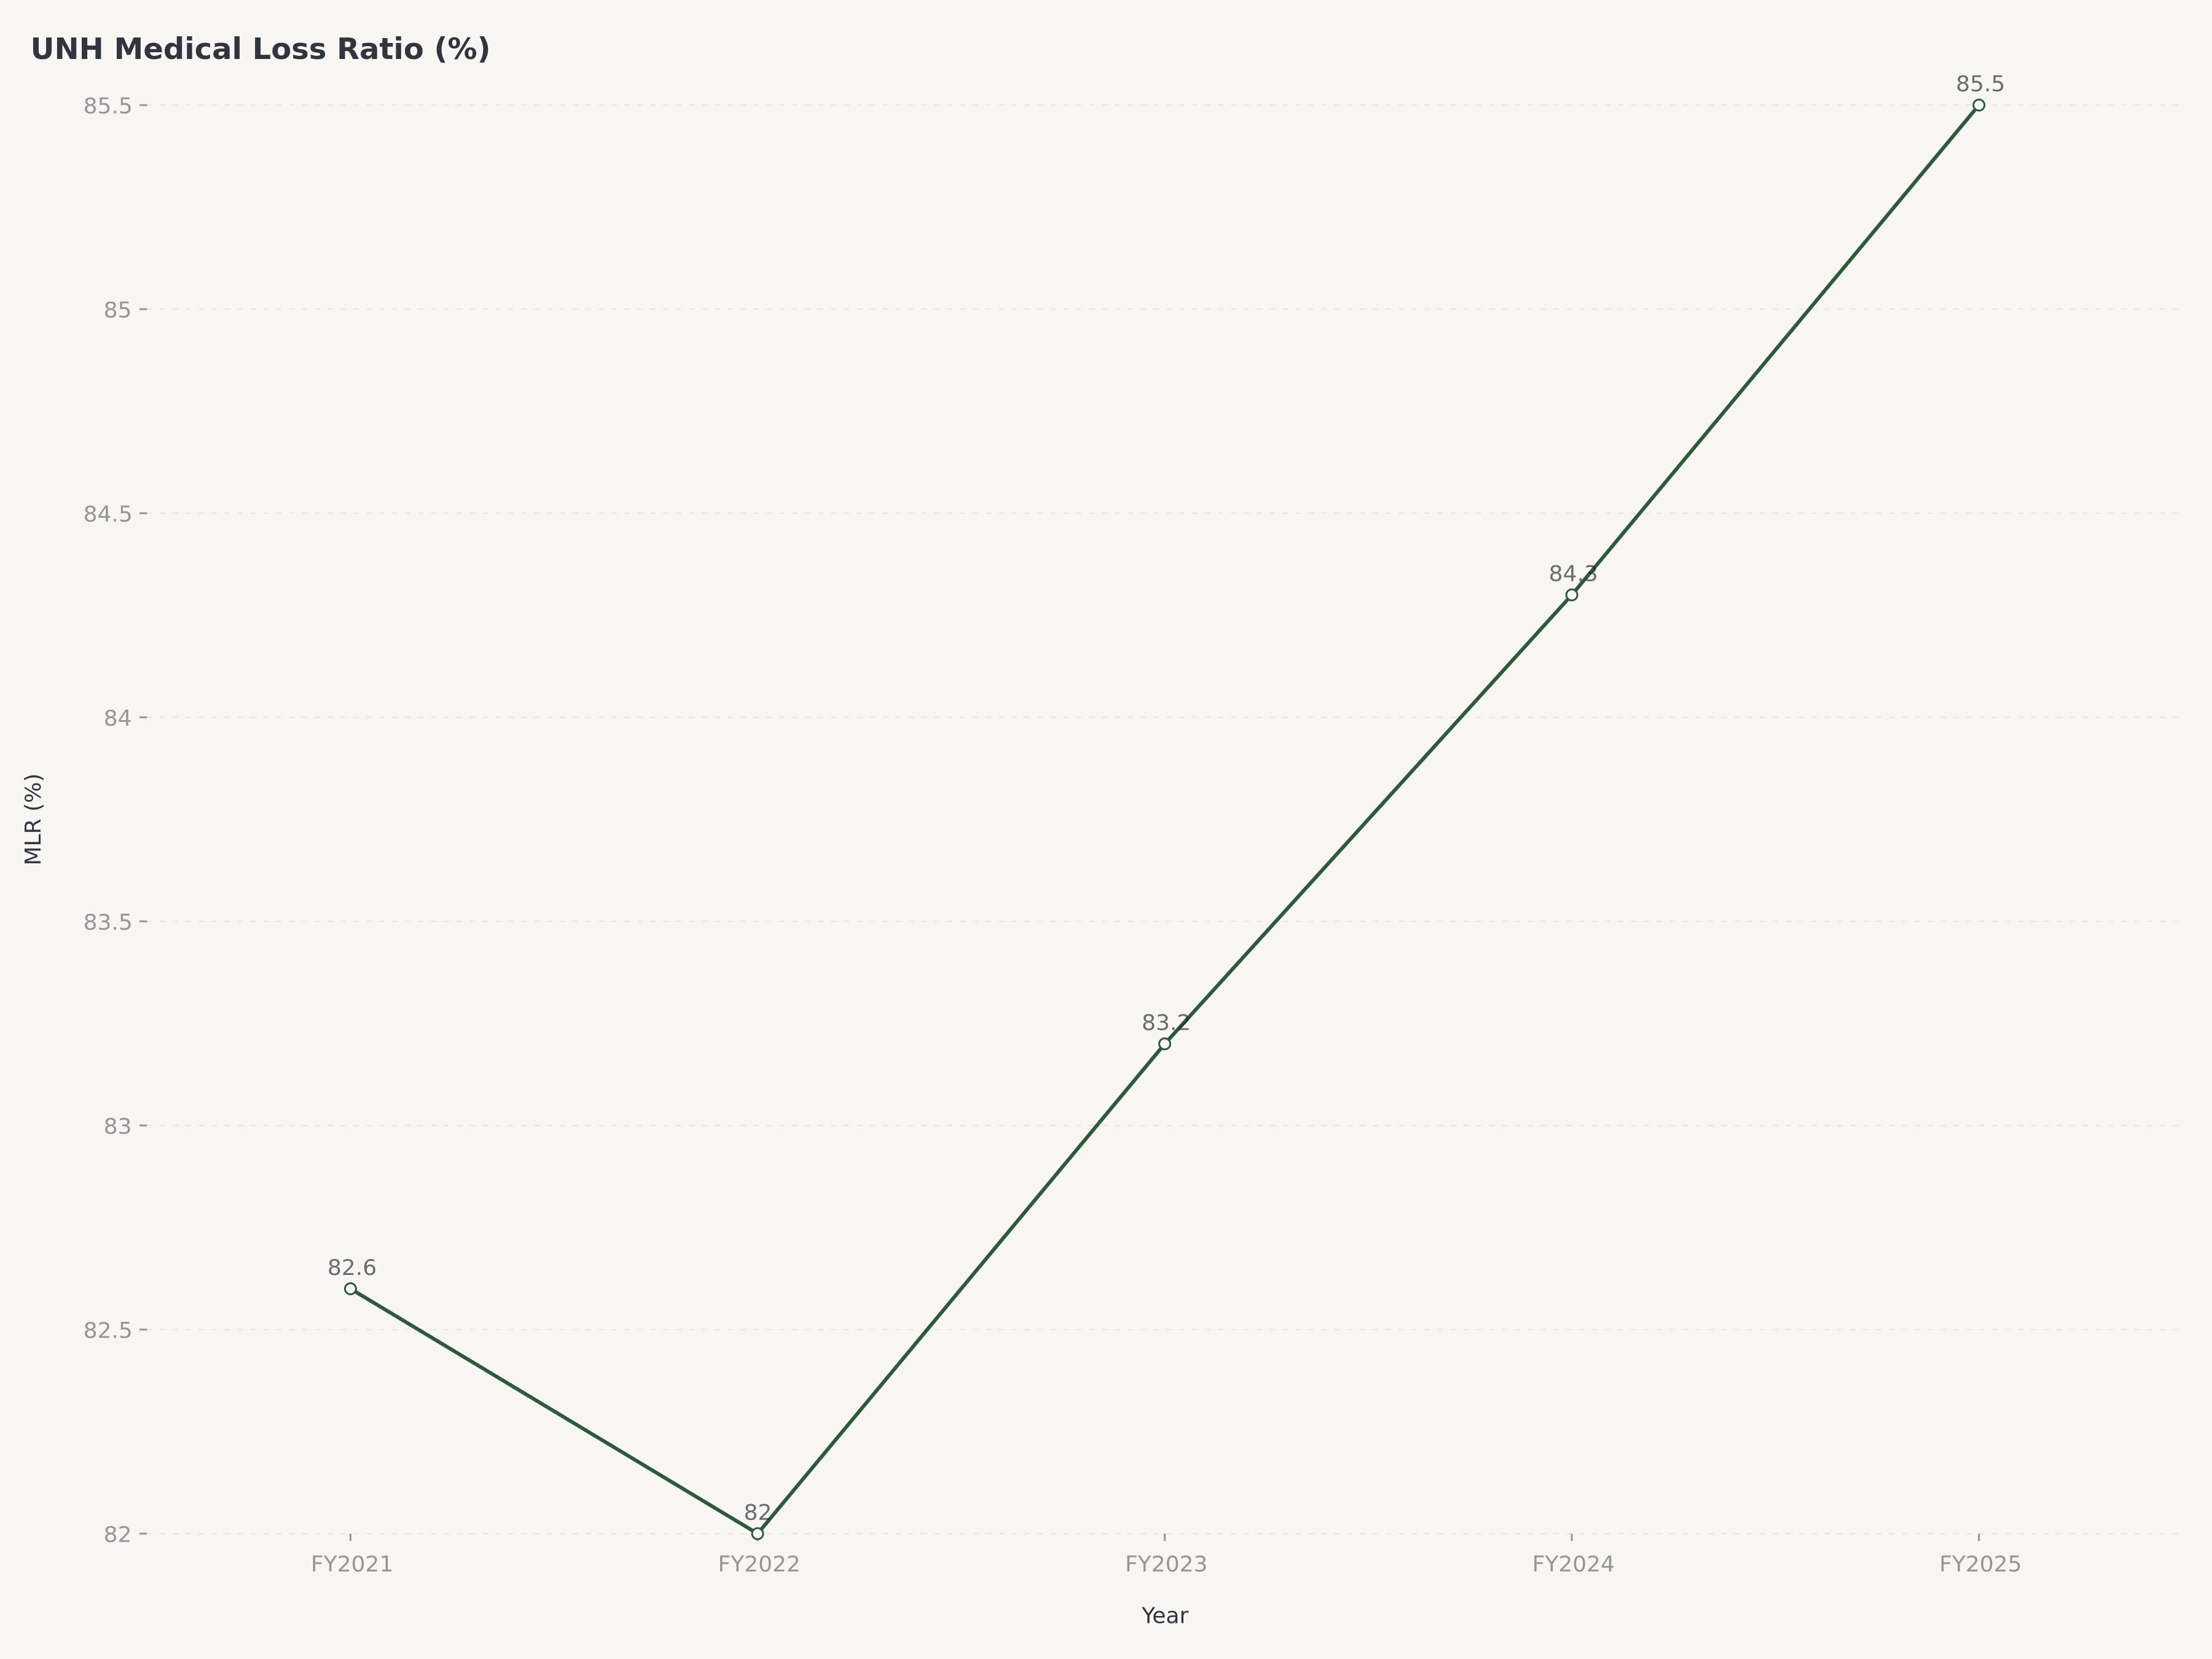
The Medical Loss Ratio — the percentage of premium revenue spent on medical claims — remains the single most important operating metric for evaluating managed care profitability. For UnitedHealthcare's commercial and Medicare Advantage books, the MLR has been managed within a range that balances competitive pricing with underwriting discipline. In an environment where medical cost trends are running at approximately 6 to 7 percent (driven by post-pandemic utilization normalization, GLP-1 drug adoption, and behavioral health demand), holding the MLR steady requires continuous operational improvement in care management, network contracting, and benefit design. The 2.8 million membership reduction should improve the blended MLR going forward by removing the highest-cost, lowest-margin cohorts.
Optum continued to outpace the consolidated growth rate. Optum Rx was the standout, driven by client wins, specialty pharmacy volume, and the integration of prior acquisitions. Revenue growth at Optum Rx benefited from the secular shift toward specialty drugs, which carry higher per-script revenue and where the PBM's ability to negotiate manufacturer rebates and manage therapy adherence creates differentiated value. Optum Health expanded its value-based care footprint, adding physician practices and extending risk-bearing arrangements with payer clients (including, but not limited to, UnitedHealthcare itself).
Capital allocation reflected management's confidence in the business trajectory. The quarterly dividend of $2.21 per share — representing an annualized payout of approximately $8.84 — positions UNH among the most reliable dividend growers in the S&P 500. The company has increased its dividend for 15 consecutive years. Management's free cash flow guidance of approximately $18 billion for FY2026 provides ample capacity for continued dividend growth, share repurchases, and bolt-on acquisitions in care delivery and technology.
Healthcare Deep Dive: Optum and the Medical Loss Ratio
Optum: The Platform That Justifies the Premium
Optum's significance to the UnitedHealth investment thesis cannot be overstated. What began as a cost center — a technology and services arm supporting the insurance parent — has evolved into an independent profit center that would rank as a Fortune 25 company on a standalone basis. The platform's three arms create a self-reinforcing competitive position.
Optum Rx processes over 1.4 billion adjusted prescriptions annually, making it one of the three largest PBMs in the United States alongside CVS Caremark and Cigna's Express Scripts. The business benefits from massive scale economics: each incremental script adds revenue at high marginal contribution because the fixed costs of formulary management, pharmacy network contracting, and technology infrastructure are already absorbed. The strategic pivot toward specialty pharmacy — where per-script economics are dramatically superior and where clinical management capabilities differentiate — has accelerated Optum Rx's revenue growth to among the fastest in the enterprise. As GLP-1 receptor agonist drugs expand from diabetes to obesity, cardiovascular risk reduction, and potentially Alzheimer's disease, Optum Rx is positioned to capture a disproportionate share of the value chain through formulary placement, prior authorization management, and outcomes-linked rebate structures.
Optum Health operates the nation's largest ambulatory care delivery network with over 100,000 aligned physicians across primary care, urgent care, surgical centers, and behavioral health. The business model is shifting from fee-for-service to full-risk capitation, where Optum Health accepts a fixed per-member-per-month payment and is responsible for managing total cost of care. This model aligns financial incentives with health outcomes and generates superior economics when clinical capabilities and data analytics enable better population health management. The physician shortage creates a structural barrier to entry: acquiring and integrating medical practices is capital-intensive, relationship-dependent, and operationally complex — all attributes that favor an incumbent with Optum's scale and institutional knowledge.
Optum Insight provides the technology and analytics layer that binds the ecosystem together. The business serves both internal UnitedHealth entities and external clients (hospitals, health systems, other payers) with revenue cycle management, clinical decision support, and population health analytics. While it is the smallest Optum segment by revenue, Insight generates the highest margins and produces the data infrastructure that makes Optum Health and Optum Rx more effective. The external-facing business also creates a subtle competitive dynamic: health systems that adopt Optum Insight's technology for their own operations become part of UnitedHealth's data ecosystem, deepening switching costs and creating intelligence advantages that benefit UnitedHealthcare's network contracting.
Medical Loss Ratio: The Margin Management Discipline
For investors evaluating UnitedHealth Group, the Medical Loss Ratio is the metric that bridges revenue growth and earnings delivery. A one-percentage-point increase in the MLR across UNH's premium base translates to approximately $2.5 to $3 billion in incremental medical costs — a figure that illustrates both the leverage inherent in the model and the existential importance of MLR management.
The current medical cost environment presents genuine challenges. Post-pandemic utilization has normalized and in some categories exceeded pre-COVID levels, as deferred procedures, behavioral health visits, and preventive screenings accelerate. GLP-1 drugs represent a particularly complex MLR variable: while they offer genuine long-term cost savings through diabetes management and weight-related comorbidity reduction, their near-term impact on pharmacy spend is substantial, with annual per-patient costs exceeding $10,000 for brand-name formulations.
UnitedHealth's advantage in MLR management derives from its integrated structure. When Optum Health physicians manage chronic conditions proactively, they reduce downstream hospital admissions and emergency department visits that drive the majority of claim costs. When Optum Rx negotiates formulary placement with pharmaceutical manufacturers, it can steer prescribing toward the most cost-effective therapies while sharing rebate economics with UnitedHealthcare's plan designs. When Optum Insight's analytics identify members at rising risk for expensive medical events, the care coordination infrastructure can intervene before costs escalate. No purely insurance-focused competitor can replicate this closed-loop optimization.
Valuation: Discount to History Creates Opportunity
UnitedHealth Group trades at a forward P/E of approximately 14.2x, a level that represents a meaningful discount to its own five-year average multiple of roughly 18 to 20x. The market capitalization of $245 billion, while enormous in absolute terms, implies the market is assigning a conglomerate discount to a business whose individual components would likely command higher standalone valuations. Optum alone, if valued at peer-comparable healthcare technology and services multiples, could warrant a valuation approaching the current enterprise value of the entire company.
Our $330 price target is derived from a four-scenario probability-weighted framework:
Bull Case (20% probability): $400. Optum Rx captures outsized GLP-1 value chain economics, Optum Health's full-risk capitation model delivers margin expansion above expectations, Q1 2026 earnings meaningfully beat consensus, and the market re-rates UNH toward its historical 18x forward P/E. This scenario requires both operational outperformance and multiple expansion, but is achievable if Hemsley's membership optimization delivers visible MLR improvement within two quarters.
Base Case (50% probability): $330. Revenue grows 8 to 10 percent in FY2026, Optum maintains its growth premium, MLR stabilizes within management's guided range following the membership reduction, and the forward P/E re-rates modestly from 14.2x toward 16x as investor confidence in the Hemsley-led strategy rebuilds. FCF of approximately $18 billion supports continued dividend growth and buybacks. This scenario requires solid execution without heroic assumptions.
Modest Underperformance Case (20% probability): $260. Medical cost trends run hotter than expected, GLP-1 drug costs create near-term MLR pressure that takes longer to mitigate, and the membership reduction creates revenue deceleration that the market penalizes at the current depressed multiple. UNH trades sideways to slightly down as investors wait for clearer evidence of margin stabilization.
Bear Case (10% probability): $200. A combination of adverse regulatory developments (aggressive Medicare Advantage rate cuts, antitrust scrutiny of Optum's vertical integration), a severe flu season or pandemic resurgence that spikes utilization, and further CEO transition uncertainty create a material de-rating event. This scenario would represent a historically extreme valuation compression for UNH but is plausible in a tail-risk environment.
Probability-weighted price target: 20% x $400 + 50% x $330 + 20% x $260 + 10% x $200 = $80 + $165 + $52 + $20 = $317. We round to $330 to reflect the additional upside optionality from Optum's platform economics and the likelihood that Hemsley's operational discipline will manifest in improved MLR trends sooner than the base case assumes.
Risks
Regulatory and political risk represents the most material threat to the investment thesis. UnitedHealth Group's vertical integration — particularly the combination of insurance underwriting, care delivery, and pharmacy benefit management under one corporate umbrella — has attracted bipartisan scrutiny from lawmakers who question whether the model creates conflicts of interest. The Federal Trade Commission has increased its focus on healthcare vertical integration, and any legislative or regulatory action that forced structural separation of Optum from UnitedHealthcare would fundamentally alter the investment case. Medicare Advantage rate-setting by CMS is an annual event that introduces binary risk to per-member economics, and the trend toward less generous risk adjustment coefficients is a persistent headwind.
Medical cost trend acceleration poses a direct threat to earnings. While the 2.8 million membership reduction is designed to improve the MLR profile, the underlying medical cost environment is intensifying. GLP-1 drug utilization is growing at a rate that could overwhelm PBM rebate negotiations, particularly if new indications (cardiovascular risk, Alzheimer's) receive FDA approval and generate a new wave of prescribing. A severe respiratory virus season, an unexpected pandemic event, or a surge in deferred surgical procedures could drive utilization above actuarial assumptions embedded in premium pricing. For a company with UNH's premium base, every 100 basis points of MLR deterioration translates to billions of dollars in margin compression.
CEO transition execution risk warrants attention. Stephen Hemsley's return was generally well-received by long-term UNH investors who credit him with building the Optum platform, but any leadership transition introduces uncertainty about strategic priorities, capital allocation philosophy, and organizational culture. The membership reduction decision — made within months of Hemsley's return — was a bold move that will take several quarters to validate through financial results. If the strategy does not produce visible MLR improvement by mid-FY2026, investor patience could erode.
Competition and disintermediation represent longer-term structural risks. Amazon's continued expansion into pharmacy and primary care (through One Medical and Amazon Pharmacy), combined with technology-native entrants applying artificial intelligence to care coordination and claims processing, could erode Optum's competitive advantages over a multi-year horizon. While UNH's scale and data moat provide substantial insulation, the healthcare technology landscape is evolving rapidly, and incumbency alone does not guarantee sustained competitive positioning.
Conclusion
UnitedHealth Group at $275.60 represents a rare opportunity to acquire the most formidable franchise in U.S. healthcare at a valuation discount that does not reflect the company's structural competitive advantages. Stephen Hemsley's return and his immediate focus on margin quality over membership volume signal a management team that understands the difference between growth and value creation. The Optum platform — particularly Optum Rx's positioning at the center of the GLP-1 pharmaceutical revolution and Optum Health's expansion of value-based care delivery — provides secular growth vectors that are largely independent of insurance underwriting cycles. At a forward P/E of 14.2x against guided free cash flow of approximately $18 billion, the risk-reward profile favors patient investors. We rate UNH Buy with a $330 price target.
For readers interested in related cross-sector themes, our analysis of Alcoa's aluminum transformation illustrates how strategic pivots in traditional industries can unlock shareholder value, while our coverage of Netflix's advertising-driven growth model explores platform economics and margin expansion dynamics in a different sector context.
Frequently Asked Questions
What does UnitedHealth Group do and how does it make money?
UnitedHealth Group operates through two primary business platforms. UnitedHealthcare is one of the largest health insurance providers in the United States, covering approximately 50 million medical members across employer-sponsored, individual, Medicare Advantage, and Medicaid plans. It earns premium revenue and manages medical costs through network contracting, care management, and benefit design. Optum is a diversified health services, technology, and pharmacy benefit management platform comprising Optum Health (care delivery with over 100,000 aligned physicians), Optum Insight (health technology and analytics), and Optum Rx (pharmacy benefits processing over 1.4 billion adjusted scripts annually). Together, these businesses generated $419.3 billion in FY2025 revenue.
What is the Medical Loss Ratio and why does it matter?
The Medical Loss Ratio is the percentage of premium revenue that a health insurer spends on medical claims and quality improvement activities. It is the single most important profitability metric for managed care companies because it determines how much of each premium dollar is retained as gross margin for operating expenses and profit. Under the Affordable Care Act, insurers are required to maintain minimum MLRs (80% for individual and small group, 85% for large group), but the operational goal is to manage the MLR as close to these floors as possible while maintaining competitive pricing and regulatory compliance. For UnitedHealth Group, each percentage point of MLR improvement across its premium base represents approximately $2.5 to $3 billion in earnings benefit.
Why did UnitedHealth reduce 2.8 million memberships?
The membership reduction was a deliberate strategic decision by returning CEO Stephen Hemsley to improve the quality of UnitedHealthcare's insurance book. By exiting approximately 2.8 million memberships concentrated in unprofitable or marginally profitable cohorts — particularly certain state Medicaid contracts and individual exchange plans with adverse risk selection — the company aims to improve its blended Medical Loss Ratio and overall earnings quality. While the decision temporarily reduced revenue scale, it reflects a sophisticated understanding that not all members contribute equally to profitability, and that a smaller, more profitable membership base can generate superior returns to shareholders.
How does Optum compare to competitors?
Optum competes across multiple healthcare subsectors. In pharmacy benefit management, Optum Rx rivals CVS Caremark and Cigna's Express Scripts as one of the three largest PBMs. In care delivery, Optum Health is the nation's largest ambulatory physician network, competing against health system-employed physician groups and private equity-backed platforms. In health technology, Optum Insight competes with specialized vendors across revenue cycle management, analytics, and clinical decision support. What differentiates Optum is the vertical integration across all three domains under UnitedHealth Group's umbrella, creating data-sharing and care coordination advantages that siloed competitors cannot replicate.
What is UnitedHealth Group's dividend and capital return outlook?
UnitedHealth Group pays a quarterly dividend of $2.21 per share, representing an annualized payout of approximately $8.84 per share. The company has increased its dividend for 15 consecutive years, establishing one of the most consistent dividend growth records in the S&P 500. With management guiding free cash flow of approximately $18 billion for FY2026, the dividend consumes only a modest portion of cash generation, leaving substantial capacity for share repurchases and strategic acquisitions. The combination of a forward P/E of 14.2x, a $245 billion market capitalization, and $18 billion in annual free cash flow generation creates a compelling total return profile of dividend income plus capital appreciation potential.
Disclaimer: This article is for informational purposes only and does not constitute investment advice, a solicitation, or a recommendation to buy, sell, or hold any security. The views expressed are those of the author and do not necessarily reflect those of Edgen.tech. Investing involves risk, including the potential loss of principal. Past performance is not indicative of future results. Healthcare investments are subject to regulatory, political, and clinical risks. Readers should conduct their own research and consult a qualified financial advisor before making investment decisions. Edgen.tech and its analysts may hold positions in securities discussed herein.
推薦閱讀