Carnival Corporation(CCL) Q1 2026 review: Weighing Deleveraging Momentum Against Fuel Volatility
Carnival Corporation(CCL) Q1 2026 review: Weighing Deleveraging Momentum Against Fuel Volatility
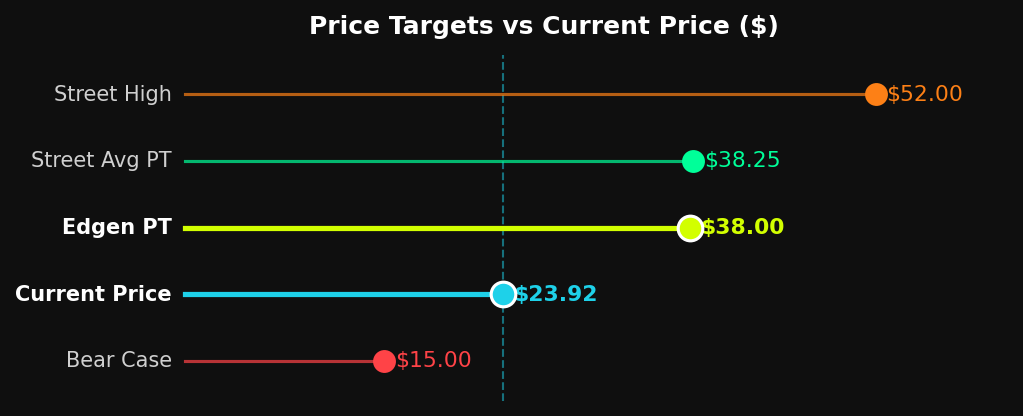
BUY | PT $38.00 | +59% Upside | Initiating Coverage
"The market is applying a 9.5x forward P/E to a $7.6B EBITDA machine with record bookings, a reinstated dividend, and $10B of debt already retired."
Current Price: $23.92 · March 19, 2026 · Edgen Research
Investment Summary
We initiate coverage on Carnival Corporation & plc (CCL) with a BUY rating and a 12-month price target of $38.00, implying 59% upside from the current price of $23.92. The market has severely mispriced CCL's transformation: the stock trades at a 9.5x forward P/E while the company has retired over $10 billion of peak debt, reinstated its dividend, launched a $1 billion share buyback, and delivered record-breaking EBITDA of $7.2B in FY2025. The world's largest cruise operator — commanding ~49% of global cruise revenue — is entering a new phase of shareholder returns, yet the valuation screen suggests this is still a distressed recovery story. It is not.
The thesis rests on three pillars. First, demand is structurally strong: booking curves are at all-time highs for 2026 and beyond, pricing is at historical peaks, and customer deposit balances hit a record $7.3B in Q1 FY2026 — a leading revenue indicator that is substantially de-risked. Second, deleveraging is accelerating. With a net debt-to-EBITDA ratio of 3.4x at year-end FY2025 (investment-grade rated by Fitch), management's target of sub-3.0x by end of FY2026 is achievable and will unlock a further re-rating. Third, the profitability gap with Royal Caribbean — the primary bear argument — is closing. Operating margins expanded 250bps in FY2025, ROIC surpassed 13% for the first time in nearly two decades, and growing high-margin onboard revenue (up 11% YoY in Q1 FY2026) is a structural tailwind the income statement has not yet fully captured.
Bull Case
• Record bookings at historical high prices lock in 2026 revenue ahead of schedule — customer deposits at record $7.3B
• Onboard revenue accelerating +11% YoY in Q1 FY2026, the highest-margin stream and the primary structural margin expansion driver
• $700M+ annual interest expense reduction by 2026 vs peak — flows directly to net income as debt is retired
• Corporate simplification (DLC unification vote Apr 17, 2026) could unlock re-rating and broader institutional investor access
• Celebration Key (Bahamas) exclusive destination — 1M guests in first 5 months, on track for 2M in 2026 and 4M by 2028
Bear Case
• Unhedged fuel strategy creates direct earnings sensitivity to oil price spikes — a key source of early 2026 negative sentiment
• ~10% Caribbean capacity increase industry-wide in 2026 could pressure pricing power in Carnival's core market
• March 2026 IT system failure caused fleet-wide embarkation delays — operational risk is real and reputationally costly
• Loyalty program transition to "Carnival Rewards" (Sep 2026) has generated significant customer backlash from VIFP members
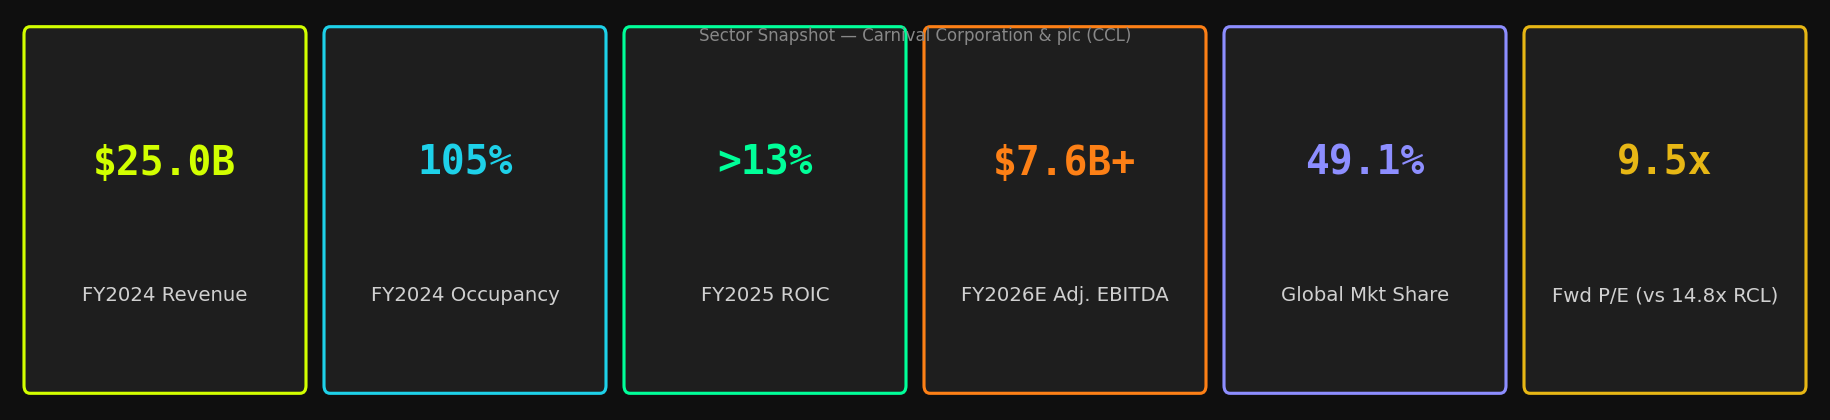
Sector Snapshot
Global cruise tourism is a $94.5B TAM in 2026 growing at a 10.2% CAGR through 2034, underpinned by rising disposable income in emerging markets, the proven resilience of the all-inclusive value proposition, and secular demand for experiential travel. Carnival is the undisputed leader in this structurally growing oligopoly, commanding approximately 49.1% of global cruise revenue — more than its two primary competitors, Royal Caribbean (RCL, ~33%) and Norwegian Cruise Line Holdings (NCLH, ~18%), combined on scale.
Financial Overview
Carnival delivered its most profitable year in company history in FY2025 (year ended November 30, 2025). Record operating income of $4.5B and adjusted EBITDA of $7.2B — expanding operating margins by over 250 basis points year-on-year — represent a complete reversal from the existential balance sheet crisis of 2020–2022. The Q1 FY2026 print reinforced this momentum: revenue of $5.81B (+7.5% YoY) and adjusted EPS of $0.13 beat the consensus estimate of ($0.02) by a decisive $0.15, with all outperformance driven by operational execution rather than one-time items.
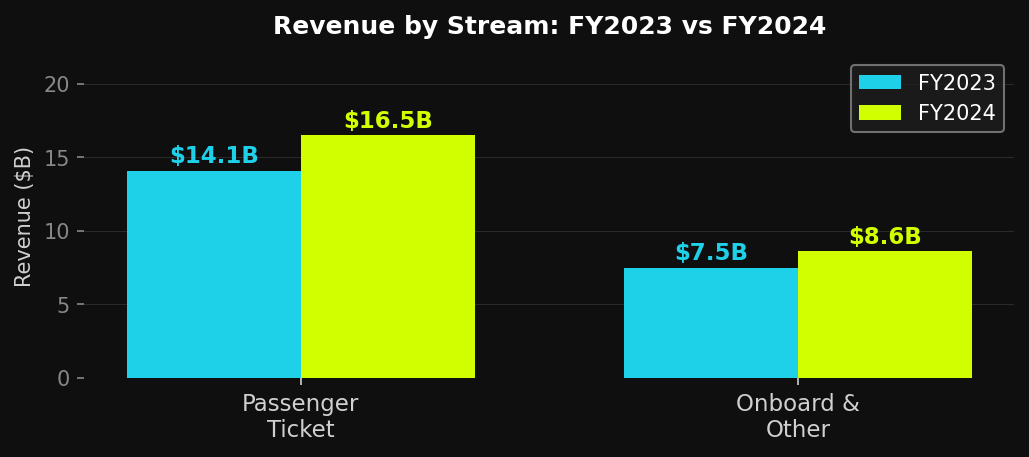
The revenue mix is improving structurally. Onboard and Other Revenue — which carries materially higher margins than ticket sales — grew 11% YoY in Q1 FY2026 versus 5.8% for ticket revenue. Onboard revenue now represents 34% of total cruise revenues and is accelerating. This widening premium over ticket growth is a critical quality-of-earnings signal the market has not fully valued. As Carnival continues to invest in specialty dining, entertainment, and exclusive destination experiences, this stream will be a primary driver of future margin expansion.
Key Financial Metrics
Metric | FY2022 | FY2023 | FY2024 | FY2025E | FY2026E (Cons.) |
|---|---|---|---|---|---|
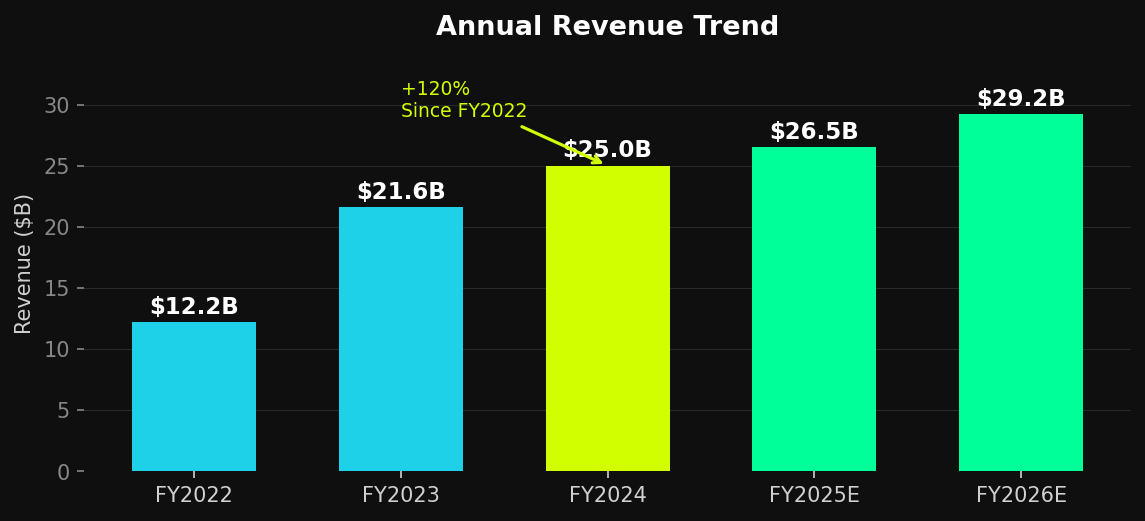
Total Revenue ($B) | 12.2 | 21.6 | 25.0 | ~26.5 | ~29.2 |
Passenger Ticket Rev ($B) | — | 14.1 | 16.5 | ~17.5 | ~19.3 |
Onboard & Other Rev ($B) | — | 7.5 | 8.6 | ~9.0 | ~9.9 |
Operating Income ($B) | — | 2.0 | 3.6 | 4.5 | ~5.2 |
Adj. EBITDA ($B) | — | — | ~5.8 | 7.2 | 7.6+ |
Net Income ($B) | (0.07) | (0.07) | 1.92 | ~3.1 | ~3.45 |
Adj. EPS ($) | — | — | — | ~$2.25 | ~$2.48 |
Occupancy (%) | 75% | 100% | 105% | 105%+ | ~105% |
ROIC | — | — | >13% | >13% | ~14%+ |
Total Debt ($B) | — | — | 27.5 | 27.0 | ~25.5 |
Company Profile
Carnival Corporation & plc is the world's largest leisure travel company, operating a dual-listed structure (NYSE: CCL / LSE: CUK) with a fleet of 94 cruise ships across nine iconic brands spanning the full spectrum from contemporary to ultra-luxury. With 269,970 passenger berths and 13.5 million guests carried in FY2024, Carnival operates an unmatched multi-brand strategy across North America/Australia (Carnival Cruise Line, Princess Cruises, Holland America, Seabourn) and Europe (Costa, AIDA, P&O Cruises UK, Cunard). The company employs approximately 160,000 team members and generated $5.9 billion in operating cash flow in FY2024 alone.
Company Quick Facts
Attribute | Detail |
|---|---|
Ticker / Exchange | CCL / NYSE · CUK / LSE |
Headquarters | Miami, Florida, USA |
CEO | Josh Weinstein (since 2022) · CFO: David Bernstein |
Fleet | 94 ships | 269,970 passenger berths |
NAA Brands | Carnival Cruise Line, Princess Cruises, Holland America Line, Seabourn |
Europe Brands | Costa Cruises, AIDA, P&O Cruises (UK), Cunard |
Key Owned Destinations | Celebration Key (Bahamas), Princess Cays, Half Moon Cay, Mahogany Bay |
FY2024 Passengers | 13.5 million |
Newbuilds on Order | 6 ships through 2033 — Excel-class (5,330–6,160 berths) |
Market Share (Rev) | ~49.1% global cruise revenue (LTM as of Mar 2026) |
Price Target Analysis
Our $38.00 price target is derived from a blended methodology: (1) a 14x forward P/E on FY2026E adjusted EPS of $2.48 — a modest discount to RCL's 14.8x reflecting the residual profitability gap — implying ~$35; (2) a 9.0x EV/EBITDA on FY2026E consensus adjusted EBITDA of $7.78B implying ~$38, consistent with RCL's trough multiple during its own post-pandemic recovery; and (3) a DCF cross-check at 8% WACC suggesting intrinsic value of $42–$46 as free cash flow accelerates with declining CapEx post-2026. The street converges: 25 of 32 covering analysts rate CCL Buy or Strong Buy with an average price target of $38.25.
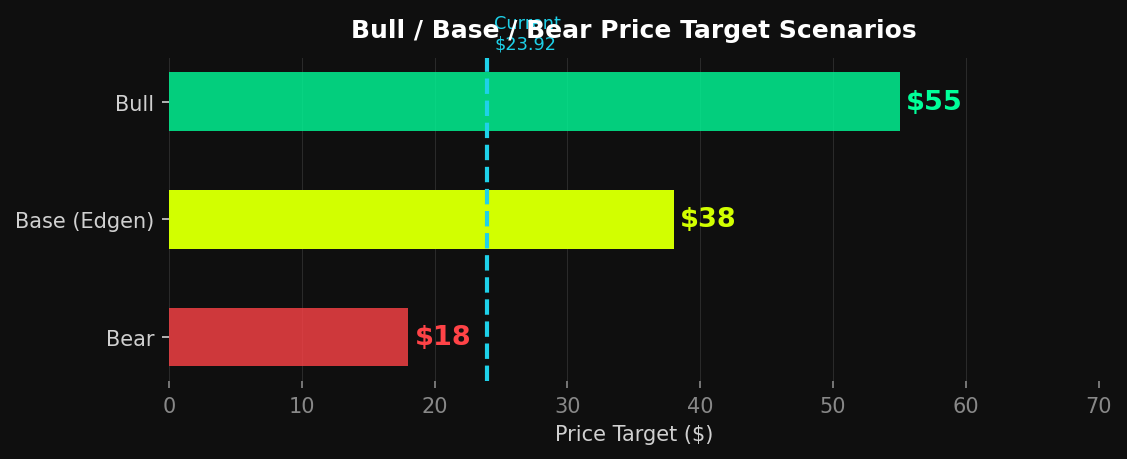
Scenario Valuation
Scenario | Price Target | Upside vs Current | Key Assumption | Probability |
|---|---|---|---|---|
Bull | $55 | +130% | P/E re-rates to 18x; oil falls; Caribbean pricing holds strong | 20% |
Base (Edgen) | $38 | +59% | Gradual re-rate to 14x as net debt/EBITDA breaks below 3.0x | 55% |
Bear | $18 | -25% | Macro shock + fuel spike compresses margins; multiple contracts to 7x | 25% |
Competitive Landscape
The cruise industry is a high-barrier oligopoly dominated by three listed players. Carnival's scale — $25B in revenue versus RCL's ~$16B and NCLH's ~$9B — provides unmatched purchasing power, port negotiating leverage, and brand portfolio breadth. However, the market correctly penalizes CCL on profitability. Royal Caribbean's TTM operating margin of 27.3% and ROIC of 14.6% materially outpace Carnival's 15.3% and 7.3% respectively. This gap is the primary reason CCL trades at a 36% discount to RCL on forward P/E. The re-rating catalyst is direct and measurable: close the profitability gap and the discount narrows.

Peer Comparison Table
Company | Ticker | Revenue | Fwd P/E | EV/EBITDA | Op. Margin | Rating |
|---|---|---|---|---|---|---|
Carnival Corp | CCL | $25.0B | 9.5x | 8.8x | 14.4% | ★ BUY $38 |
Royal Caribbean | RCL | ~$16.3B | 14.8x | 12.1x | 27.3% | N/R |
Norwegian Cruise | NCLH | ~$9.6B | 8.2x | 9.4x | ~16% | N/R |
MSC Cruises | Priv. | ~$8.0B | — | — | — | N/R |
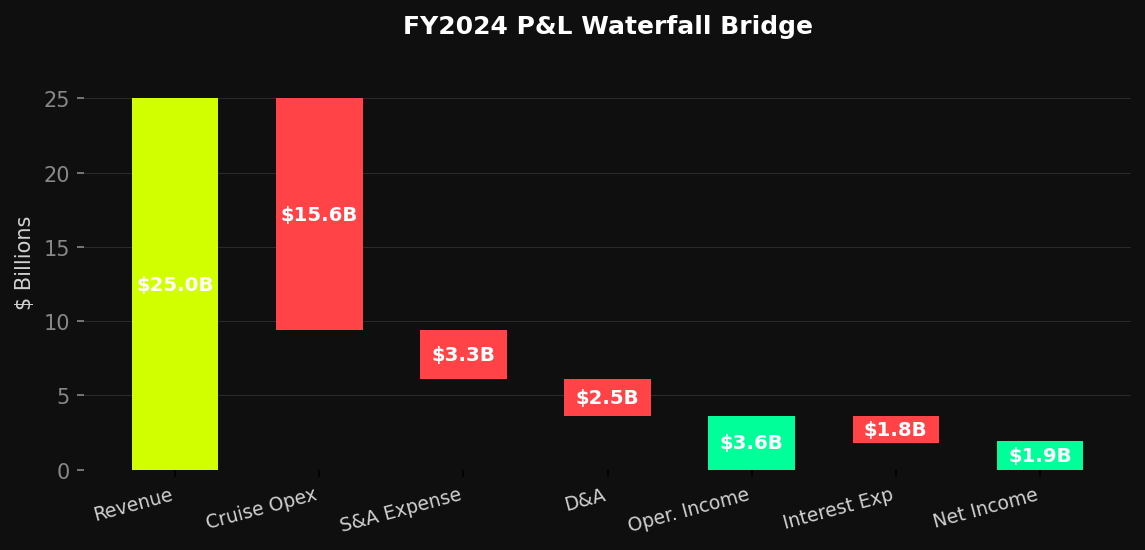
FY2024 P&L Waterfall Bridge
The FY2024 P&L demonstrates Carnival's improved — but still-improving — cost structure. $25.0B of revenue translates to $3.6B of operating income (14.4% margin). The key remaining drag on net income is $1.8B of net interest expense, a figure management is systematically reducing through aggressive deleveraging. Every dollar of debt retired converts directly to incremental net income and free cash flow. With interest expense projected to fall over $700M from peak by 2026, the income statement leverage is powerful.
Key Catalysts
• Q1 FY2026 earnings beat (Feb 2026): revenue $5.81B (+7.5% YoY) and adjusted EPS $0.13 crushed the ($0.02) consensus; full-year guidance reiterated
• DLC Corporate Simplification Vote — April 17, 2026: unification of NYSE/LSE dual listing expected to enhance trading liquidity and reduce governance friction
• Sub-3.0x Net Debt/EBITDA by end of FY2026: management target that will likely trigger credit upgrades and signal capacity for accelerated share buybacks
• Celebration Key ramp-up: on track for 2M guests in 2026 and 4M by 2028 — each visit drives incremental high-margin onboard spend
• Dividend reinstated: $0.15/share quarterly (Feb 2026); trajectory toward pre-COVID $0.50/share signals durable management confidence in free cash flow
• Excel-class newbuild deliveries 2027–2033: five new Carnival Cruise Line ships (5,330–6,160 berths) at best-in-class LNG fuel efficiency
Risk Factors
• Unhedged fuel exposure: oil price spikes flow directly to the income statement — a sustained move higher would pressure FY2026 EPS materially
• Caribbean supply shock: ~10% industry-wide capacity growth in 2026 requires pricing discipline from all operators to sustain yield levels
• IT system failure (March 2026): fleet-wide embarkation delays and onboard disruptions — reputational cost and operational risk remain real
• Macro / consumer recession risk: cruising is discretionary; sharp spending pullbacks could force last-minute discounting and pressure close-in yields
• Loyalty program execution risk: "Carnival Rewards" spend-based transition (Sep 2026) has generated backlash from high-frequency VIFP club members
• EU Emissions Trading System: rising regulatory carbon costs as the phase-in accelerates through 2026 and beyond — manageable but a growing headwind
Verdict
BUY | PT $38.00 | 59% Upside
The market is making a category error with Carnival Corporation. It is pricing CCL like a post-crisis recovery name with existential leverage risk. The evidence says otherwise. The balance sheet has been fundamentally repaired — $10B of peak debt retired, investment-grade leverage achieved, dividend reinstated, and buybacks initiated. Forward booking curves are at all-time price highs. Q1 FY2026 delivered a comprehensive beat on every metric. The structural demand tailwind from experiential travel and a 10% CAGR global cruise market through 2034 provides a durable topline runway that is independent of shorter-term macro cycles.
The remaining bear case — the profitability gap versus Royal Caribbean — is real but actively narrowing. Every quarter of continued margin expansion, every dollar of debt retired, and every new high-margin destination opened shrinks the discount at which CCL should trade. With a record $7.3B of customer deposits already locked for FY2026 voyages and management guiding to $3.45B+ of full-year adjusted net income, the earnings are substantially de-risked. At 9.5x forward earnings, the market is not paying for any of this progress.
For the thesis to play out: (1) Carnival executes its FY2026 guidance with near-full-year bookings at historical high prices, (2) net debt continues declining toward the <3.0x target, and (3) the April 2026 corporate simplification is approved. All three are visible and within management's demonstrated capabilities. BUY.
Frequently Asked Questions
Why does CCL trade at such a discount to Royal Caribbean?
The valuation gap is partially justified by RCL's superior profitability (TTM ROE of 45.8% vs CCL's 25.4%) and structurally higher margins. However, the gap has widened beyond what the fundamentals warrant. CCL's forward P/E of 9.5x versus RCL's 14.8x implies a 36% discount that does not adequately reflect CCL's record EBITDA, aggressive deleveraging, or the improving quality of its onboard revenue stream. As CCL demonstrates sustained margin improvement through 2026–2027, we expect the discount to compress materially and view the current spread as the primary return driver.
Is the $27B debt level still a material concern?
It was — it no longer should be at the same risk weighting. From a peak of $35B+ in early 2023, total debt has been reduced to approximately $27B through $10B of prepayments and refinancings. The net debt-to-EBITDA ratio has fallen to 3.4x (investment-grade per Fitch, positive outlook from S&P), and management targets sub-3.0x by end of FY2026. The debt maturity profile is well-structured: $1.4B due in FY2026, $2.0B in FY2027 — both manageable from operating cash flow of ~$5-6B annually. Coupled with a $4.5B revolving credit facility fully undrawn, the liquidity position is robust.
What is the fuel risk from Carnival's unhedged policy?
Carnival's unhedged fuel strategy has been a double-edged sword. Fuel represents approximately 11–12% of cruise operating costs. Management has historically defended the no-hedge policy on the grounds that hedging costs more over long periods than the volatility it prevents. In early 2026, rising global oil prices contributed to market concerns that overshadowed strong operational execution — a direct cause of the recent 24% stock price decline. While this remains the single most significant near-term earnings risk, the company's record booking position and sustained pricing power provide a meaningful natural offset. The risk is real but is being priced far more severely than it warrants at current oil levels.
Edgen Research · March 19, 2026 · For informational purposes only. Not investment advice. All financial data sourced from Carnival Corporation 10-K (FY2024), 10-Q (Q3 FY2025), and proprietary analysis.


Your money person, finally.
Try Ed free. No credit card. No commitment.