
Gold's 28% slide from its January record accelerated as $100 Brent crude and a 4.70% 10-year yield pushed September rate-hike odds to 80%.
Gold's 28% slide from its January record accelerated as $100 Brent crude and a 4.70% 10-year yield pushed September rate-hike odds to 80%.
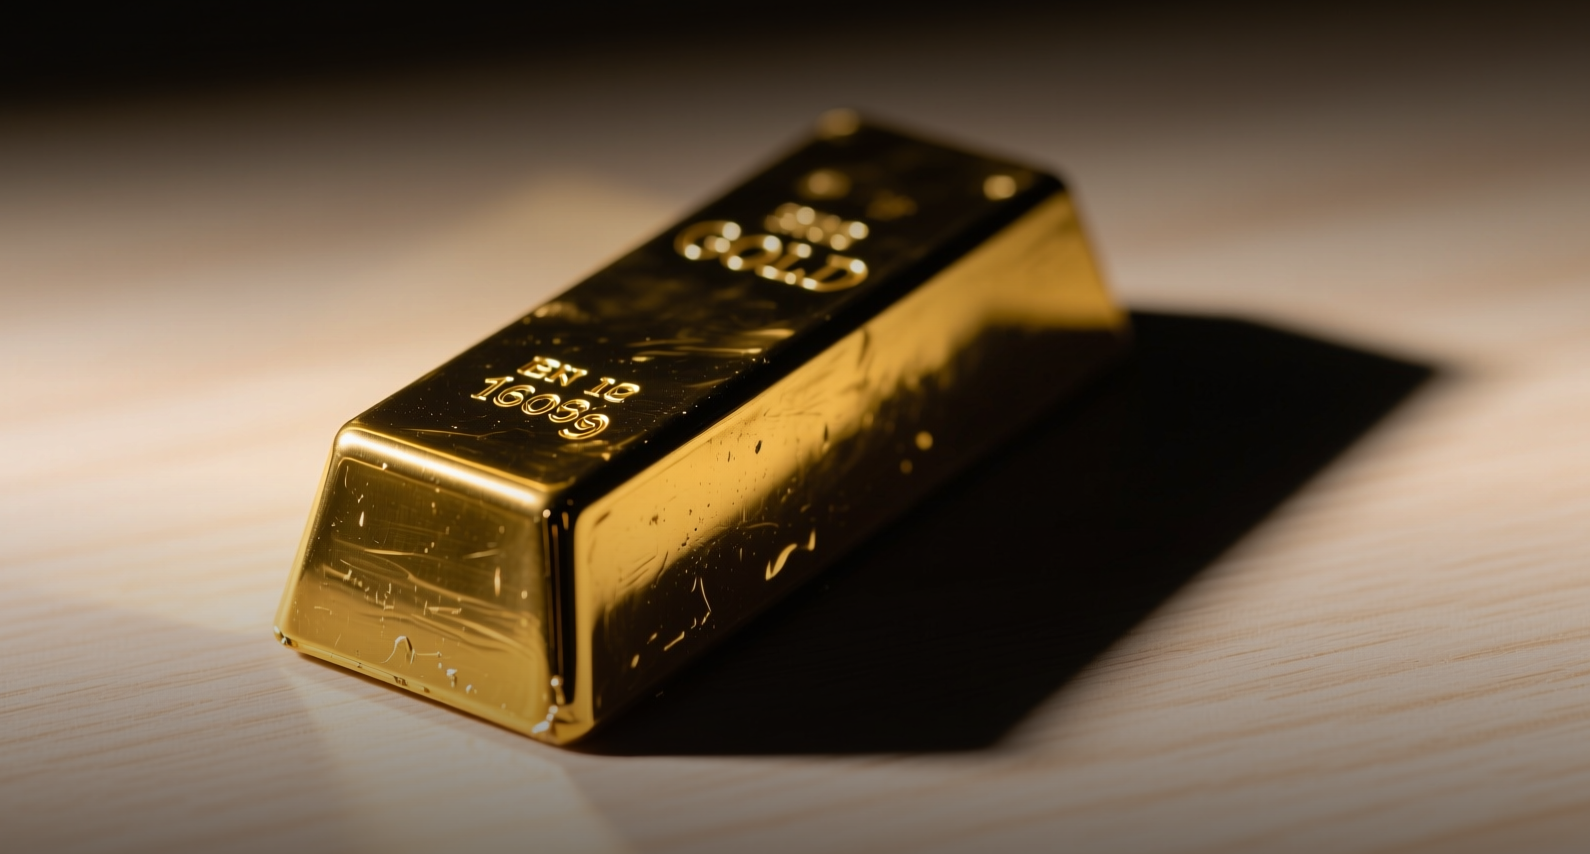
Gold's 28% slide from its January record accelerated as $100 Brent crude and a 4.70% 10-year yield pushed September rate-hike odds to 80%.
Gold traded near $4,000 an ounce on July 23, down 28% from its January record, as Brent crude breached $100 and the 10-year Treasury yield hit 4.70%.
JPMorgan cut its fourth-quarter gold forecast to $4,500 an ounce from $6,000 on July 3, with analysts at the bank seeing Q3 averaging $4,300, according to a research note.
Markets now price an 80% probability of a Federal Reserve rate hike at the September meeting, according to CME FedWatch data, as the inflationary shock from $100 oil pushes the central bank toward tightening. The 10-year yield settled above 4.70%, while the US Dollar Index climbed to a 13-month high. Gold has spent 31 consecutive trading days below its 200-day moving average, the longest such streak since 2022, with a death cross active since the 50-day average crossed below the 200-day line.
The $4,000 level represents a critical technical threshold. A sustained break below it could trigger selling toward the low $3,000s, while a recovery above the 200-day moving average near $4,400 would signal a potential reversal. The September Fed meeting and upcoming inflation data will determine the next direction.
$100 Brent Reshapes the Macro Backdrop
The US-Iran conflict that escalated in late February sent oil prices up roughly 30%, with Brent crude crossing $100 a barrel on July 23. The inflationary impulse from higher energy costs pushed markets to price out Fed rate cuts and price in hikes, inverting the typical safe-haven logic that would normally benefit gold during geopolitical stress. The 10-year real yield climbed above 4.50%, raising the opportunity cost of holding non-yielding bullion.
Fund Managers Flip on Valuation
The Bank of America July Global Fund Manager Survey showed a net 6% of 181 institutional managers now call gold undervalued, the first negative overvaluation reading since March 2023. The last time sentiment flipped this way, gold traded below $2,000 before rallying to $5,598 in January 2026. Average cash levels dropped to 3.6% of assets, triggering a contrarian sell signal under BofA's Cash Rule for risk assets.
What Banks Now Forecast
JPMorgan cut its Q4 2026 gold forecast to $4,500 an ounce from $6,000 on July 3, seeing Q3 averaging $4,300. Goldman Sachs lowered its year-end target to $4,900 from $5,400 in June, warning that an actual Fed hike could push prices to $4,400. ING trimmed its Q3 and Q4 forecasts to $4,300 and $4,600 respectively, citing a stronger dollar and softer demand. All three banks maintained a bullish long-term view, pointing to central-bank buying of roughly 60 tonnes a month as a structural floor.
This article is for informational purposes only and does not constitute investment advice.
