
内容
摘要
为何内存现在重要:AI 超级周期有两个引擎
两家公司,两条路径:商业模式比较
经营业绩:数字并排对比
美光 Q2 FY2026(2026 年 2 月 26 日截止季度)
闪迪 Q2 FY2026(2025 年 12 月 26 日截止季度,2026 年 1 月 2 日发布)
头对头财务摘要
估值差距:定价完美执行 vs 定价完美无瑕
美光估值情景(来自 Edgen 360° 报告,2026 年 3 月 21 日)
闪迪估值情景(来自 Edgen 360° 报告,2026 年 4 月 12 日)
差异化的 AI 故事:HBM 主导 vs NAND 加速
竞争定位:DRAM 寡头 vs NAND 大宗商品
催化剂与风险
美光催化剂(近期)
美光风险
闪迪催化剂(近期)
闪迪风险
结论:买入 MU,持有 SNDK
我们观点的风险
结语
FAQ
2026 年哪只内存股更好——MU 还是 SNDK?
什么是 HBM,为什么对美光重要?
为什么闪迪股价 2026 年涨幅如此之大?
DRAM 和 NAND 有什么区别,哪个从 AI 中受益更多?
什么会改变我们对 MU 的买入评级或对 SNDK 的持有评级?

市场太复杂?来问 Edgen Search。

答案即刻呈现,信息绝无水分,让你做出决胜未来的交易决策。

立即体验 Search

Micron vs SanDisk:AI内存超级周期的两面——为何美光的HBM胜局比闪迪的NAND狂欢更重要

· Apr 15 2026
Micron vs SanDisk:AI内存超级周期的两面——为何美光的HBM胜局比闪迪的NAND狂欢更重要

板块:半导体 — 内存(DRAM、NAND、HBM) 分类:科技与AI > 半导体 | 财报 | 代码:$MU, $SNDK

摘要

  • MU 和 SNDK 都创下了 Q2 FY2026 的历史业绩纪录,且都受益于同一轮 AI 内存超级周期,但当前股价的风险/回报特征却显著不同:MU 在 $465.66 比其概率加权公允价值 $423 高出约 10%,而 SNDK 在 $944.51 则比其概率加权公允价值 $698 高出约 35%
  • 美光的 HBM 业务是皇冠上的明珠:Q2 FY2026 的 HBM 营收达 $2.18B(环比 +22%),HBM3E 36GB 已批量出货,HBM4 已向六家合作伙伴送样——使 MU 有望在 CY2026 与 SK 海力士和三星一起占据约 20% 的 HBM TAM
  • 闪迪自 2025 年 2 月从 Western Digital 分拆以来累计上涨 2,228%,2026 年初至今上涨 +301%,热情主要由 BiCS10(与 NVIDIA 联合开发的 332 层 NAND)以及具有投机性的"高带宽闪存"(HBF)机会驱动,但当前股价正在定价一个完美无瑕的执行情景,而历史上这种情景的容错空间极小
  • 买入 MU:以合理估值获取最清晰的多年期 HBM 可见度;持有 SNDK:等待显著回调或 BiCS10/HBF 营收的具体进展再加仓——2026 年 4 月 20 日纳入纳斯达克 100 指数将带来被动资金支持,但并不会改变底层估值数学

为何内存现在重要:AI 超级周期有两个引擎

内存半导体行业正在经历十年一遇的转型。与逻辑芯片不同——后者市场已基本围绕台积电的代工主导地位整合——内存仍然是一个寡头垄断但高度竞争的市场,围绕两种截然不同的技术构建:DRAM(动态随机存取存储器,用于处理器邻近的易失性存储)和 NAND 闪存(用于 SSD 和移动设备的非易失性存储)。十多年来,内存股一直被视为周期性大宗商品标的,伴随着剧烈的繁荣-萧条周期。AI 革命从根本上改变了这一叙事。

变化最明显的是高带宽内存(HBM),这是一种最初为显卡开发的专用 3D 堆叠 DRAM 架构,现在已成为每一颗出货 AI 加速器不可或缺的伴侣。NVIDIA H100 GPU 内含 80GB HBM3,更新的 H200 内含 141GB HBM3e,即将推出的 Blackwell B200 平台设计搭载 192GB HBM3e。每一代都使每颗 GPU 的 HBM 含量翻倍或翻三倍,而超大规模厂商的资本开支——微软、谷歌、亚马逊、Meta 在 2026 年合计投入超过 $3500 亿用于 AI 基础设施——几乎全部部署到大量消耗 HBM 的系统中。结果是:HBM 在 2023 年仅占 DRAM 营收市场的不到 5%,预计到 2027 年将超过 50%。这是 AI 内存超级周期的第一个引擎,而美光是仅有的三家具有制造能力的厂商之一(另外两家是 SK 海力士和三星)。

第二个引擎更安静但同样重要:企业级 NAND 存储的转型。AI 推理工作负载——服务用户查询的已训练模型的日常运营——需要大量快速、高容量的 SSD 存储来保存模型权重、缓存激活值和流式传输训练数据。基于现代 QLC NAND 构建的数据中心 SSD 现在每盘出货容量达 122TB,从传统硬盘到企业级 SSD 的转换正在加速。闪迪于 2025 年 2 月从 Western Digital 分拆出来,现在是一家纯粹的 NAND 公司,直接受益于这一转换。其 BiCS10 架构——与 NVIDIA 联合开发的 332 层 NAND 技术——使闪迪定位于下一波 AI 优化存储。

不寻常之处——也是这篇对比文章必要的原因——在于市场目前对这同一超级周期的两个引擎给出了截然不同的定价。美光按 AI 增强基本面交易在约 12 倍前瞻市盈率。闪迪在四个月内近乎翻四倍后,交易在约 20 倍前瞻市盈率。两者都被华尔街多数分析师评为买入。投资者的问题是:从这里开始哪一个能提供更好的风险调整回报。

两家公司,两条路径:商业模式比较

美光科技是一家完全整合的内存制造商,业务涵盖 DRAM、NAND 和 NOR 内存。总部位于爱达荷州博伊西,由 CEO Sanjay Mehrotra 领导(他是早期 SanDisk 和 Spansion 的资深人士),美光数十年来一直是上市公司,并且在整个现代内存时代都是财富 500 强。其业务围绕四个分部组织:计算和网络业务部(CNBU)——容纳 HBM 和数据中心 DRAM,目前是主要增长引擎;移动业务部(MBU)服务智能手机 OEM;存储业务部(SBU)面向基于 NAND 的客户端和企业级 SSD;嵌入式业务部(EBU)面向汽车和工业应用。Q2 FY2026 中,CNBU 占营收约 57%,同比增长 120% 以上,几乎完全由 HBM 和高容量 DDR5 服务器 DRAM 驱动。

相比之下,闪迪公司是一家纯粹的 NAND 闪存公司,由 Western Digital 在 2025 年 2 月分拆而来。在 CEO David Goeckeler(他也带领母公司完成了分拆)的领导下,董事会包括来自整个企业存储行业的技术资深人士,闪迪以比其更多元化的同行更敏锐、更专注的策略运营。其业务涵盖云(最高增长板块——Q2 FY2026 占营收 24%,同比增长 185%)、客户端(占营收 60%,包括企业和消费 SSD)和消费(可移动闪存卡和便携式存储)。闪迪的制造业务主要通过与日本铠侠(Kioxia)的长期合资企业进行——这一合作既奠定了公司的成本结构,也持续引发关于潜在合并或更紧密整合的猜测。

哲学差异很重要。美光是水平整合的内存领导者:当 DRAM 上行时,HBM 上行,NAND 也上行,美光从三者中受益。当任何一个下行时,其他两个通常会缓冲冲击。闪迪是垂直聚焦的 NAND 专业公司:当 NAND 价格走强、企业 SSD 需求激增时,闪迪获得不成比例的上行杠杆。当 NAND 供过于求回归时(如 2023-2024 年),闪迪也会承受不成比例的痛苦。投资美光是购买内存复合体的多元化敞口;投资闪迪是购买专门针对 NAND 的集中、高 beta 敞口。

经营业绩:数字并排对比
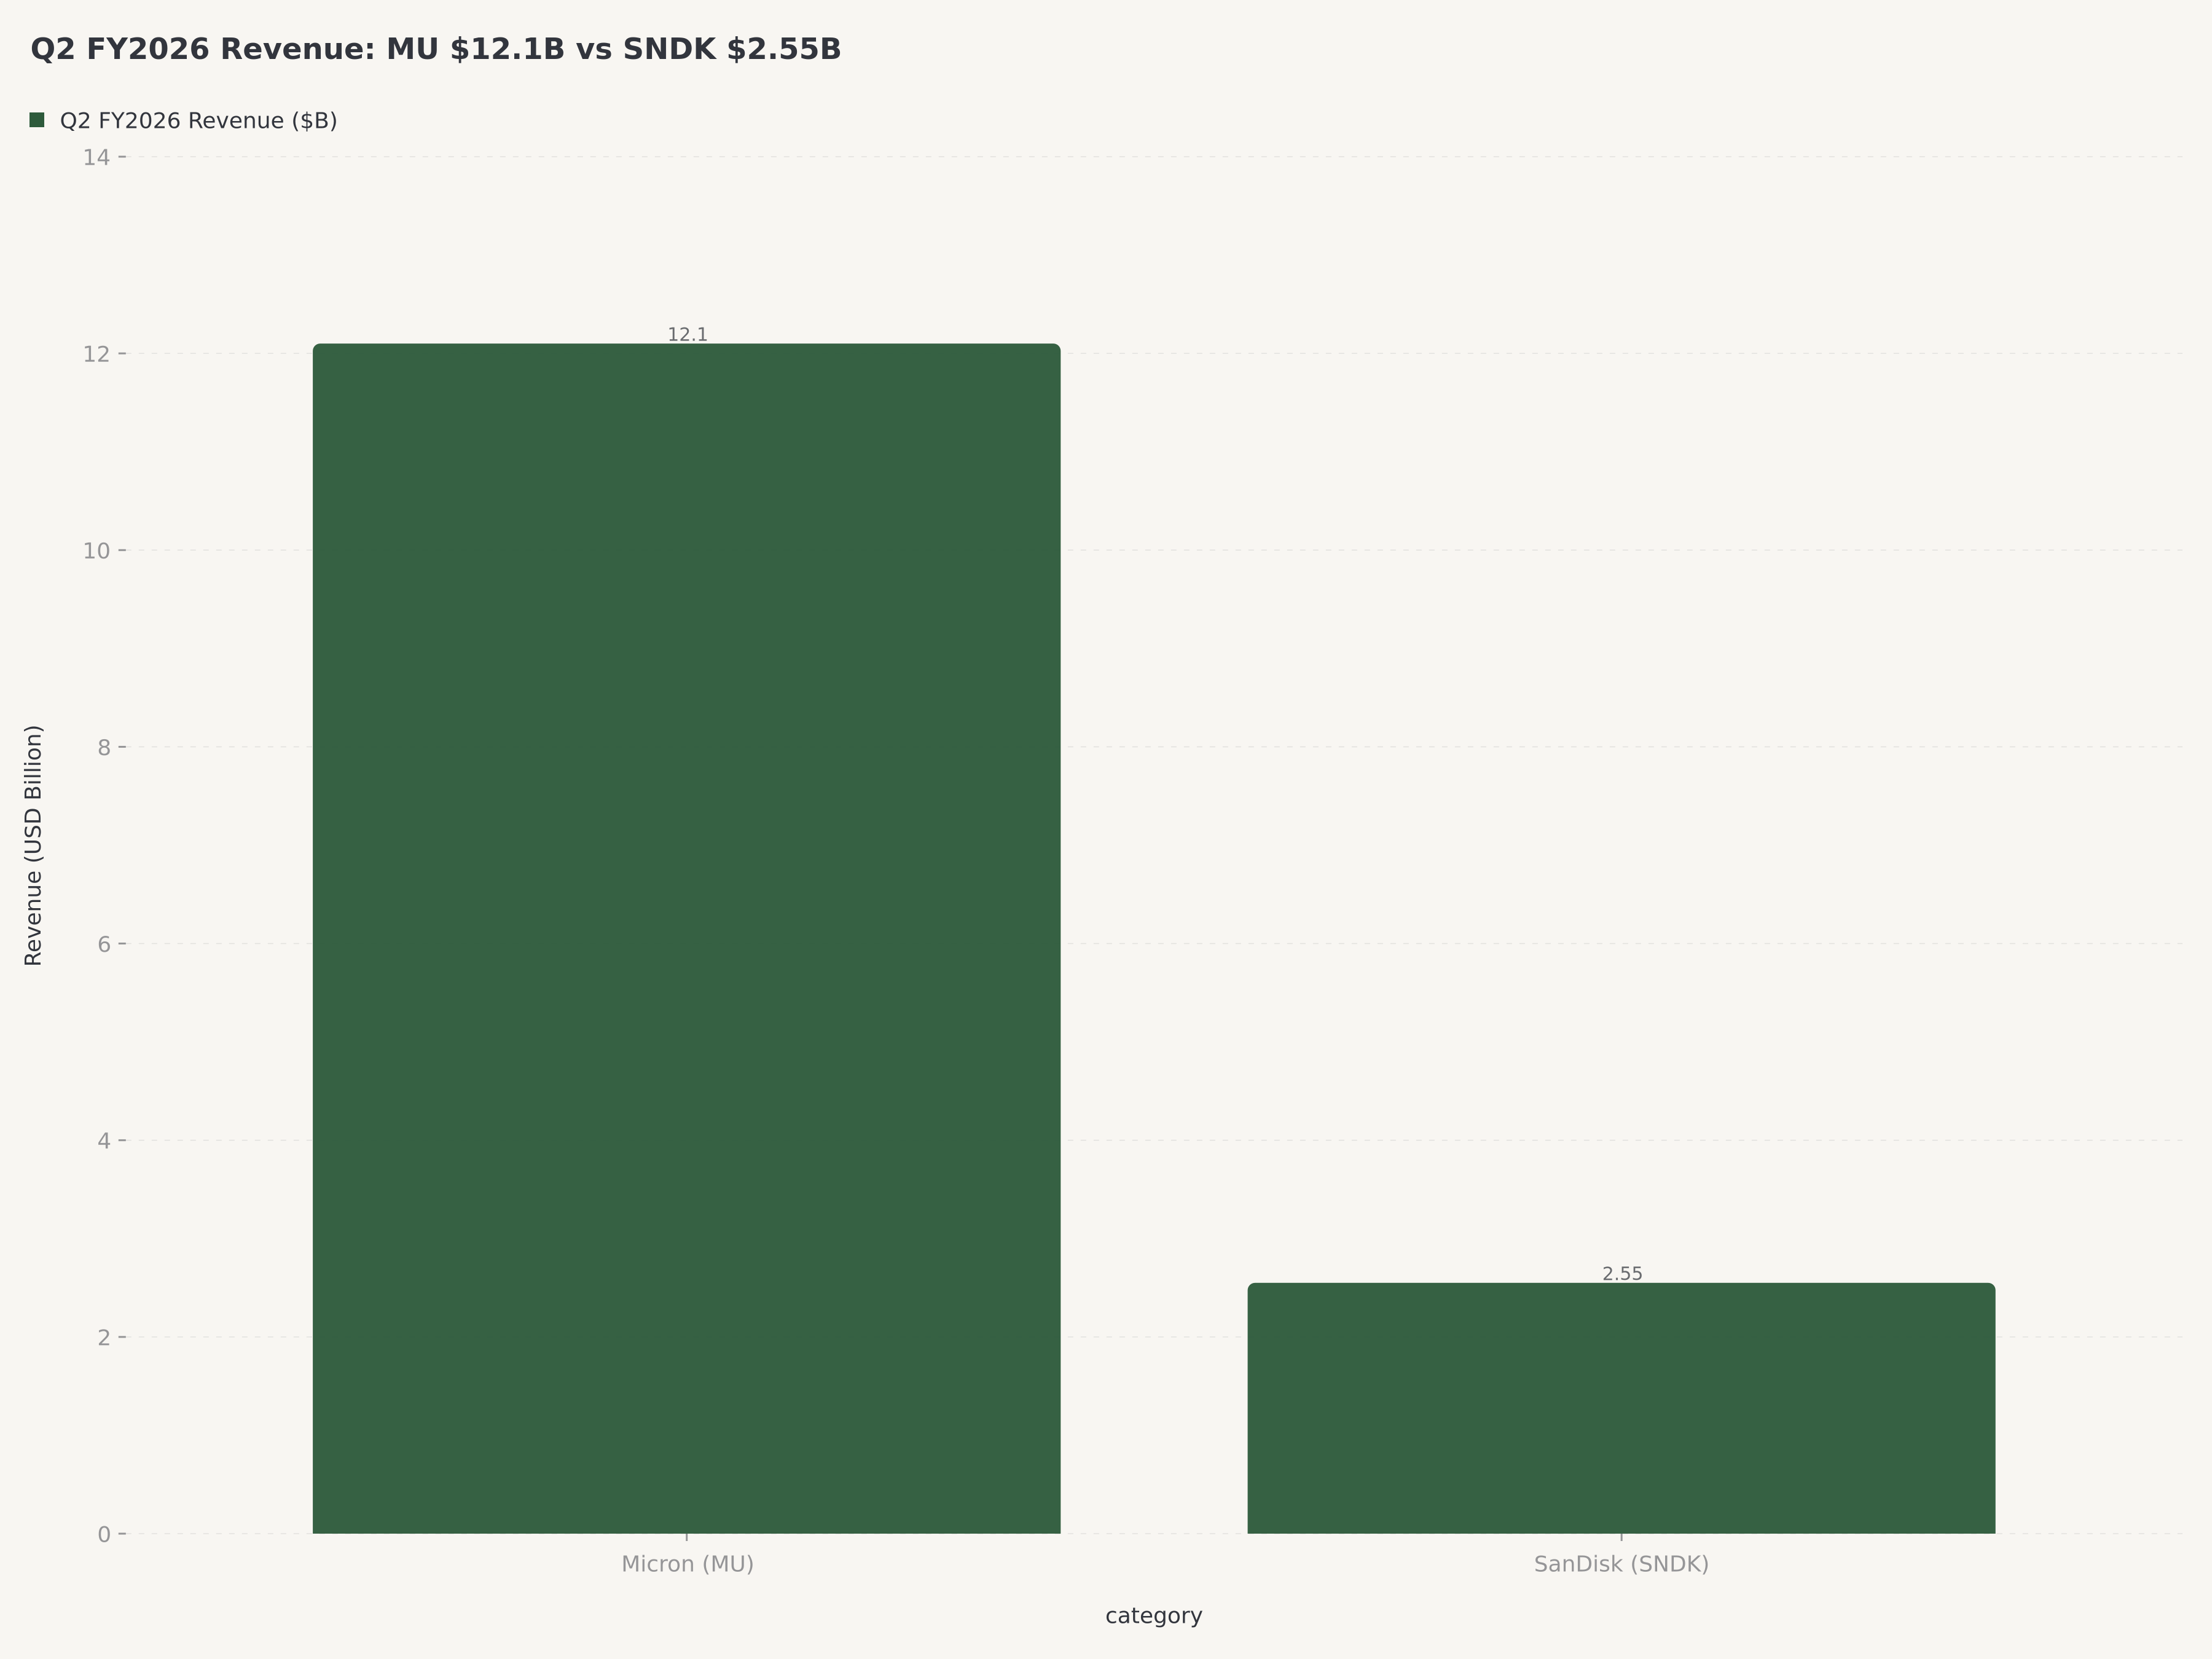
Q2 FY2026 营收:MU $12.1B(同比 +84%)vs SNDK $2.55B(同比 +40%),显示 4.7 倍规模差距
美光 vs 闪迪:Q2 FY2026 营收与增长对比。来源:公司财报、Edgen 360° 报告。

两家公司在几周内相继公布 Q2 FY2026 业绩,且都大幅超出共识。但超预期的幅度和构成讲述了不同的故事。

美光 Q2 FY2026(2026 年 2 月 26 日截止季度)

美光实现营收 $12.1B(同比 +84%,环比 +17%),创单季纪录。Non-GAAP 摊薄 EPS 为 $3.22,超过共识 $2.95,是公司历史上单季最佳盈利能力。GAAP 毛利率扩张至 45.3%,高于去年同期 22.5%——23 个百分点的扩张反映了 HBM 的定价权和向高利润数据中心产品的产品组合转移。Non-GAAP 营业利润率达到 37.8%,同样创纪录。

分部细分清晰地讲述了 AI 故事。CNBU(计算和网络)产生约 $6.9B 营收,其中 HBM 单独贡献 $2.18B——高于 Q1 FY2026 的 $1.78B(环比 +22%)。管理层指引 HBM 营收将在财年 2026 超过 $8B,意味着到财年末退出运行率约为年化 $10-12B。HBM3E 36GB 已批量出货给多家超大规模客户,HBM4 样品正在与六家合作伙伴进行验证,计划在 2026-2027 日历年量产爬坡。美光在 CY2026 目标 HBM 市场份额约 20%,高于 2025 年估计的 15%。

Q3 FY2026 指引(在 Q2 财报会上公布)预计营收约 $12.5B 上下浮动 $5 亿,Non-GAAP 毛利率预计进一步扩张至 46-47% 区间,Non-GAAP EPS 指引约 $3.25。管理层将前景特征化为"在 HBM 上具体可见度现已延伸至财年 2027 的多个季度",相对于内存公司典型的较谨慎季度评论,这是显著的措辞转变。
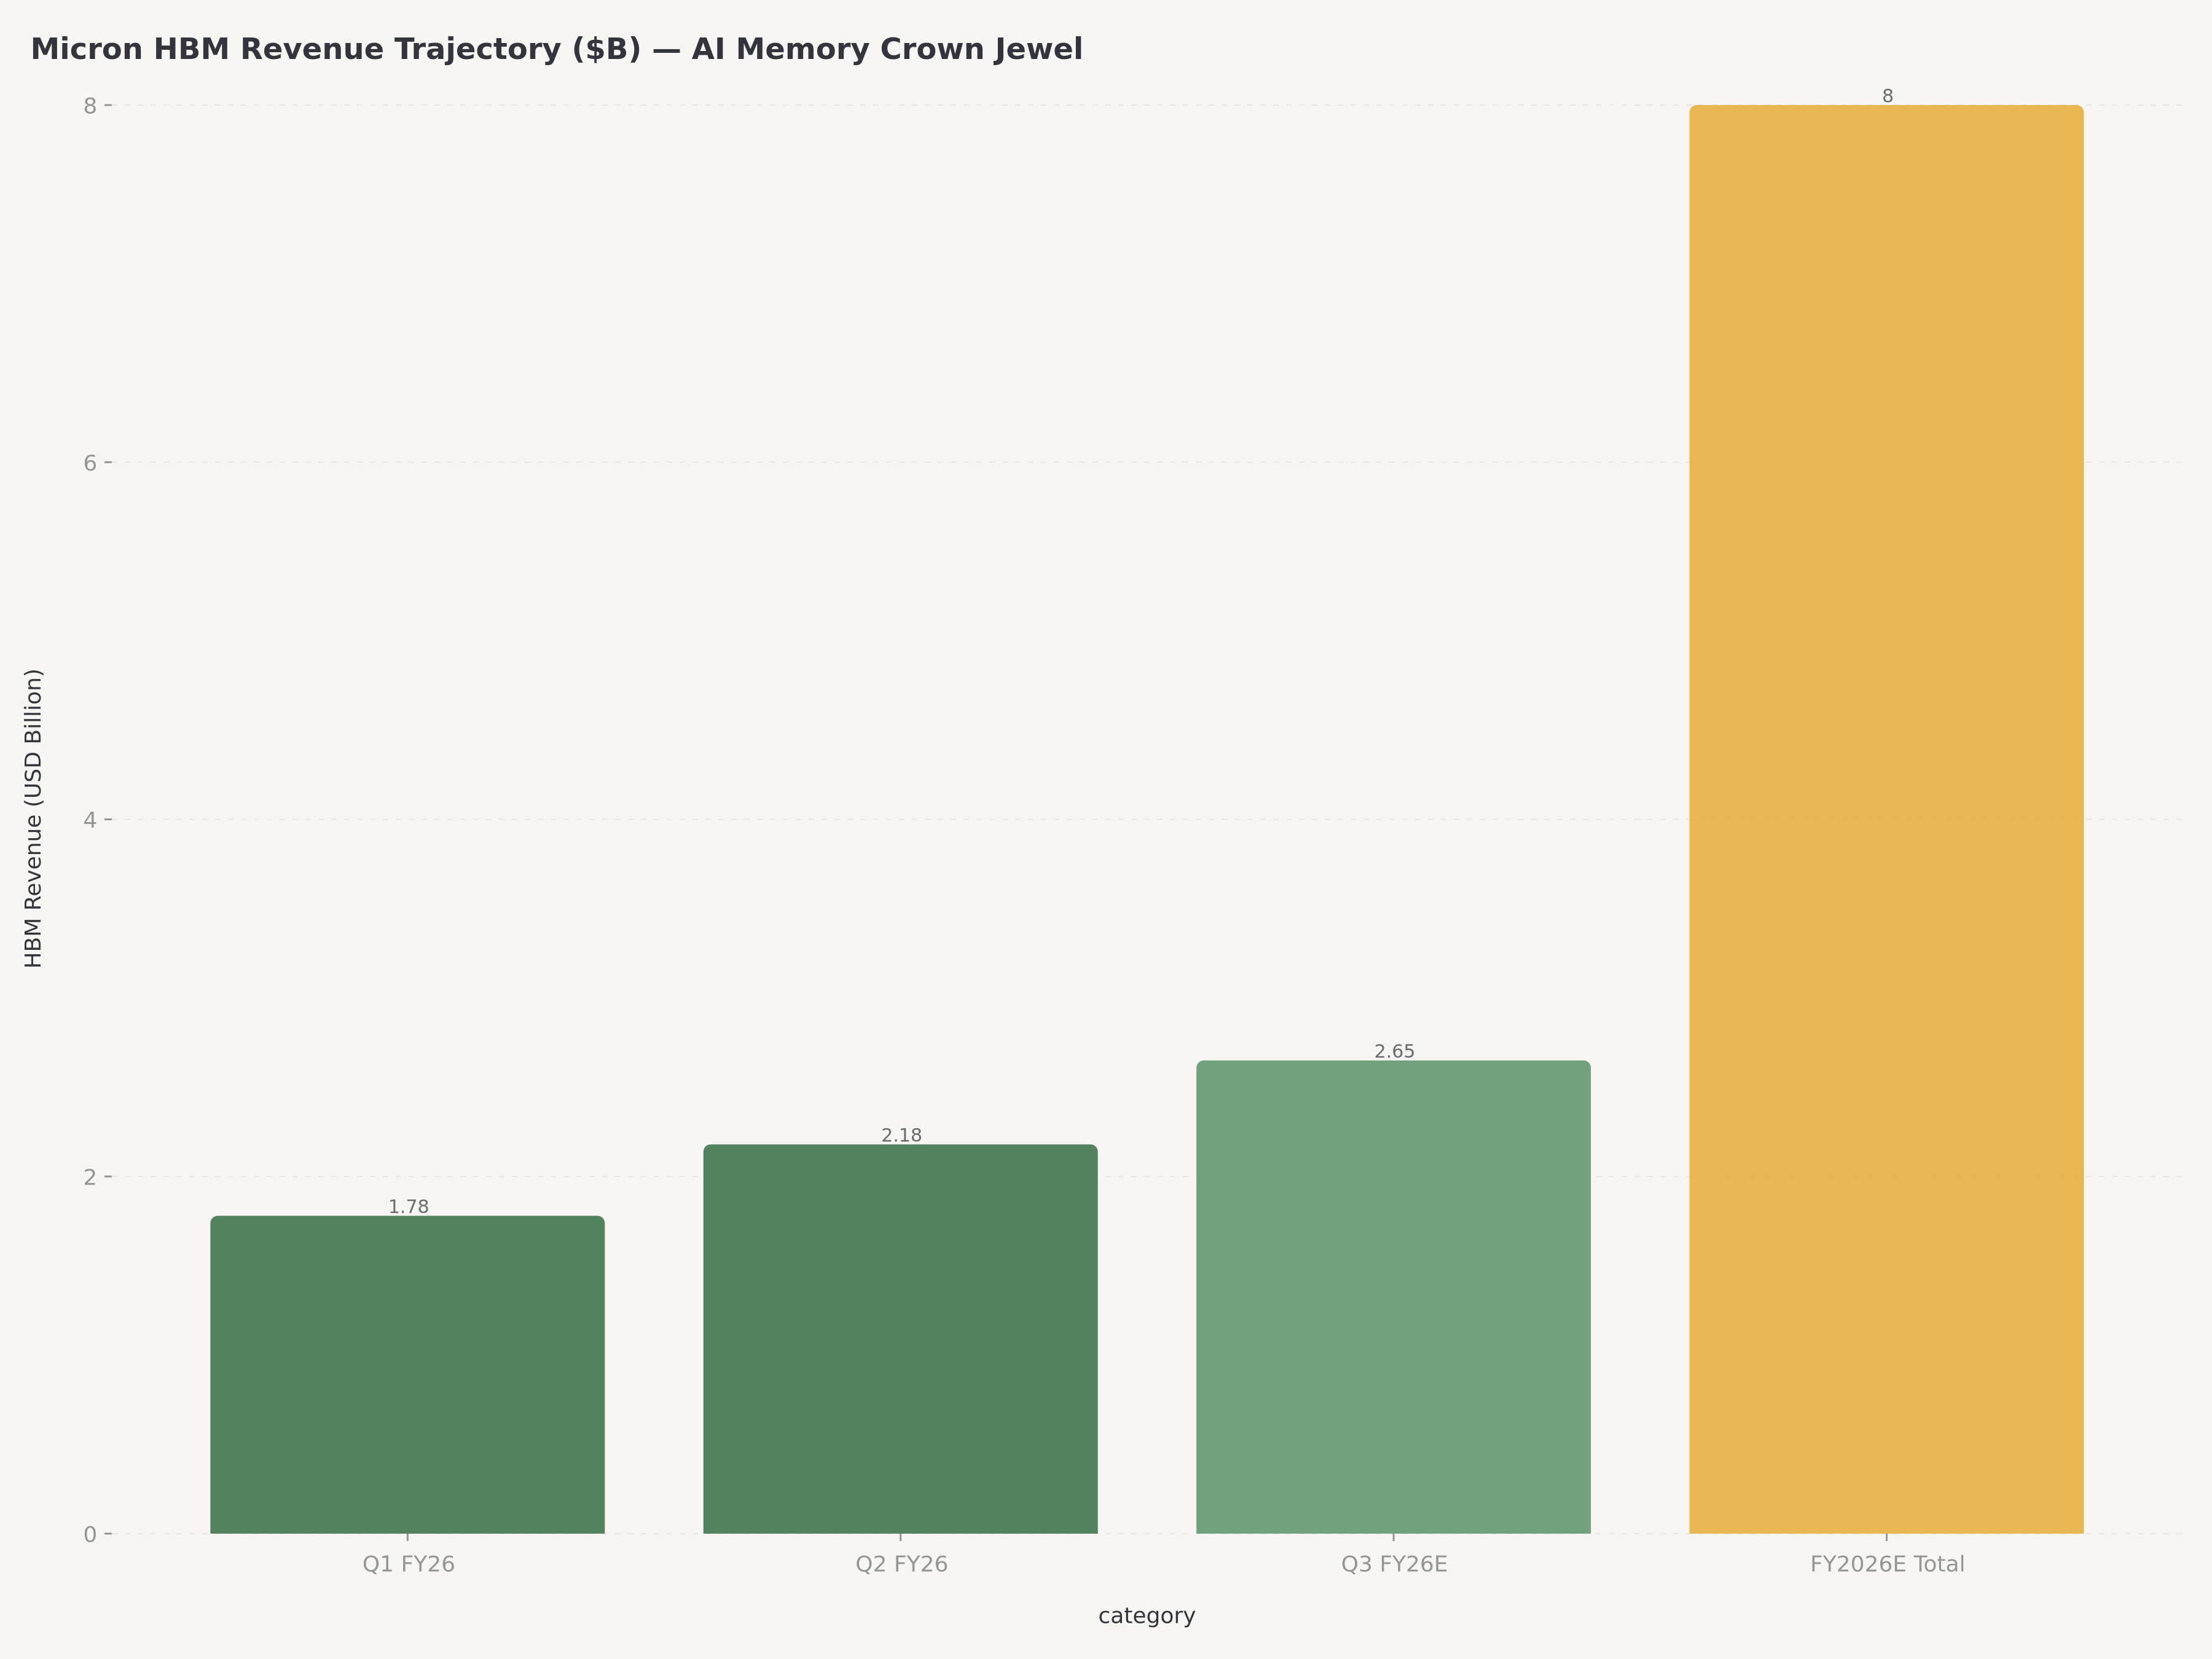
美光 HBM 营收轨迹:Q1 FY2026 $1.78B、Q2 FY2026 $2.18B(环比 +22%),指引在财年 2026 超过 $8B
美光 HBM 营收轨迹——AI 内存业务加速。来源:美光财报、Edgen 360° 报告。

闪迪 Q2 FY2026(2025 年 12 月 26 日截止季度,2026 年 1 月 2 日发布)

闪迪实现营收 $2.55B(同比 +40%,环比 +17%),显著高于前期指引 $2.40-2.50B 的高端。Non-GAAP EPS 为 $3.00,高于共识 $2.94。Non-GAAP 毛利率大幅扩张至 35%,高于去年同期 23%——12 个百分点的扩张由向更高平均售价的企业和数据中心 SSD 的产品组合转移驱动。Q2 单季自由现金流达 $843M,这一数字在分拆前的 NAND 格局下几乎不可思议。

分部细分突显了增长集中之处。数据中心分部贡献约 24% 营收,同比增长 185%,反映了基于闪迪先进 3D NAND 技术构建的企业 SSD 的爆炸性需求。客户端,包括企业终端 SSD 和消费 SSD,占营收 60%,增长在 40-50% 区间。消费(可移动存储)是最小且增长最慢的分部,占营收 16%。

Q3 FY2026 指引尤为激进:营收 $3.20-3.40B(意味着相对 Q2 环比增长约 25-33%)、Non-GAAP 毛利率 36-42%、Non-GAAP EPS $3.35-4.45。该 EPS 区间的中点 $3.90 相对 Q2 的 $3.00 环比增长 30%,且区间本身异常宽(与中点相差 ±14%),反映了对内存定价轨迹、BiCS10 爬坡时机和 HBF 机会变现的高不确定性。
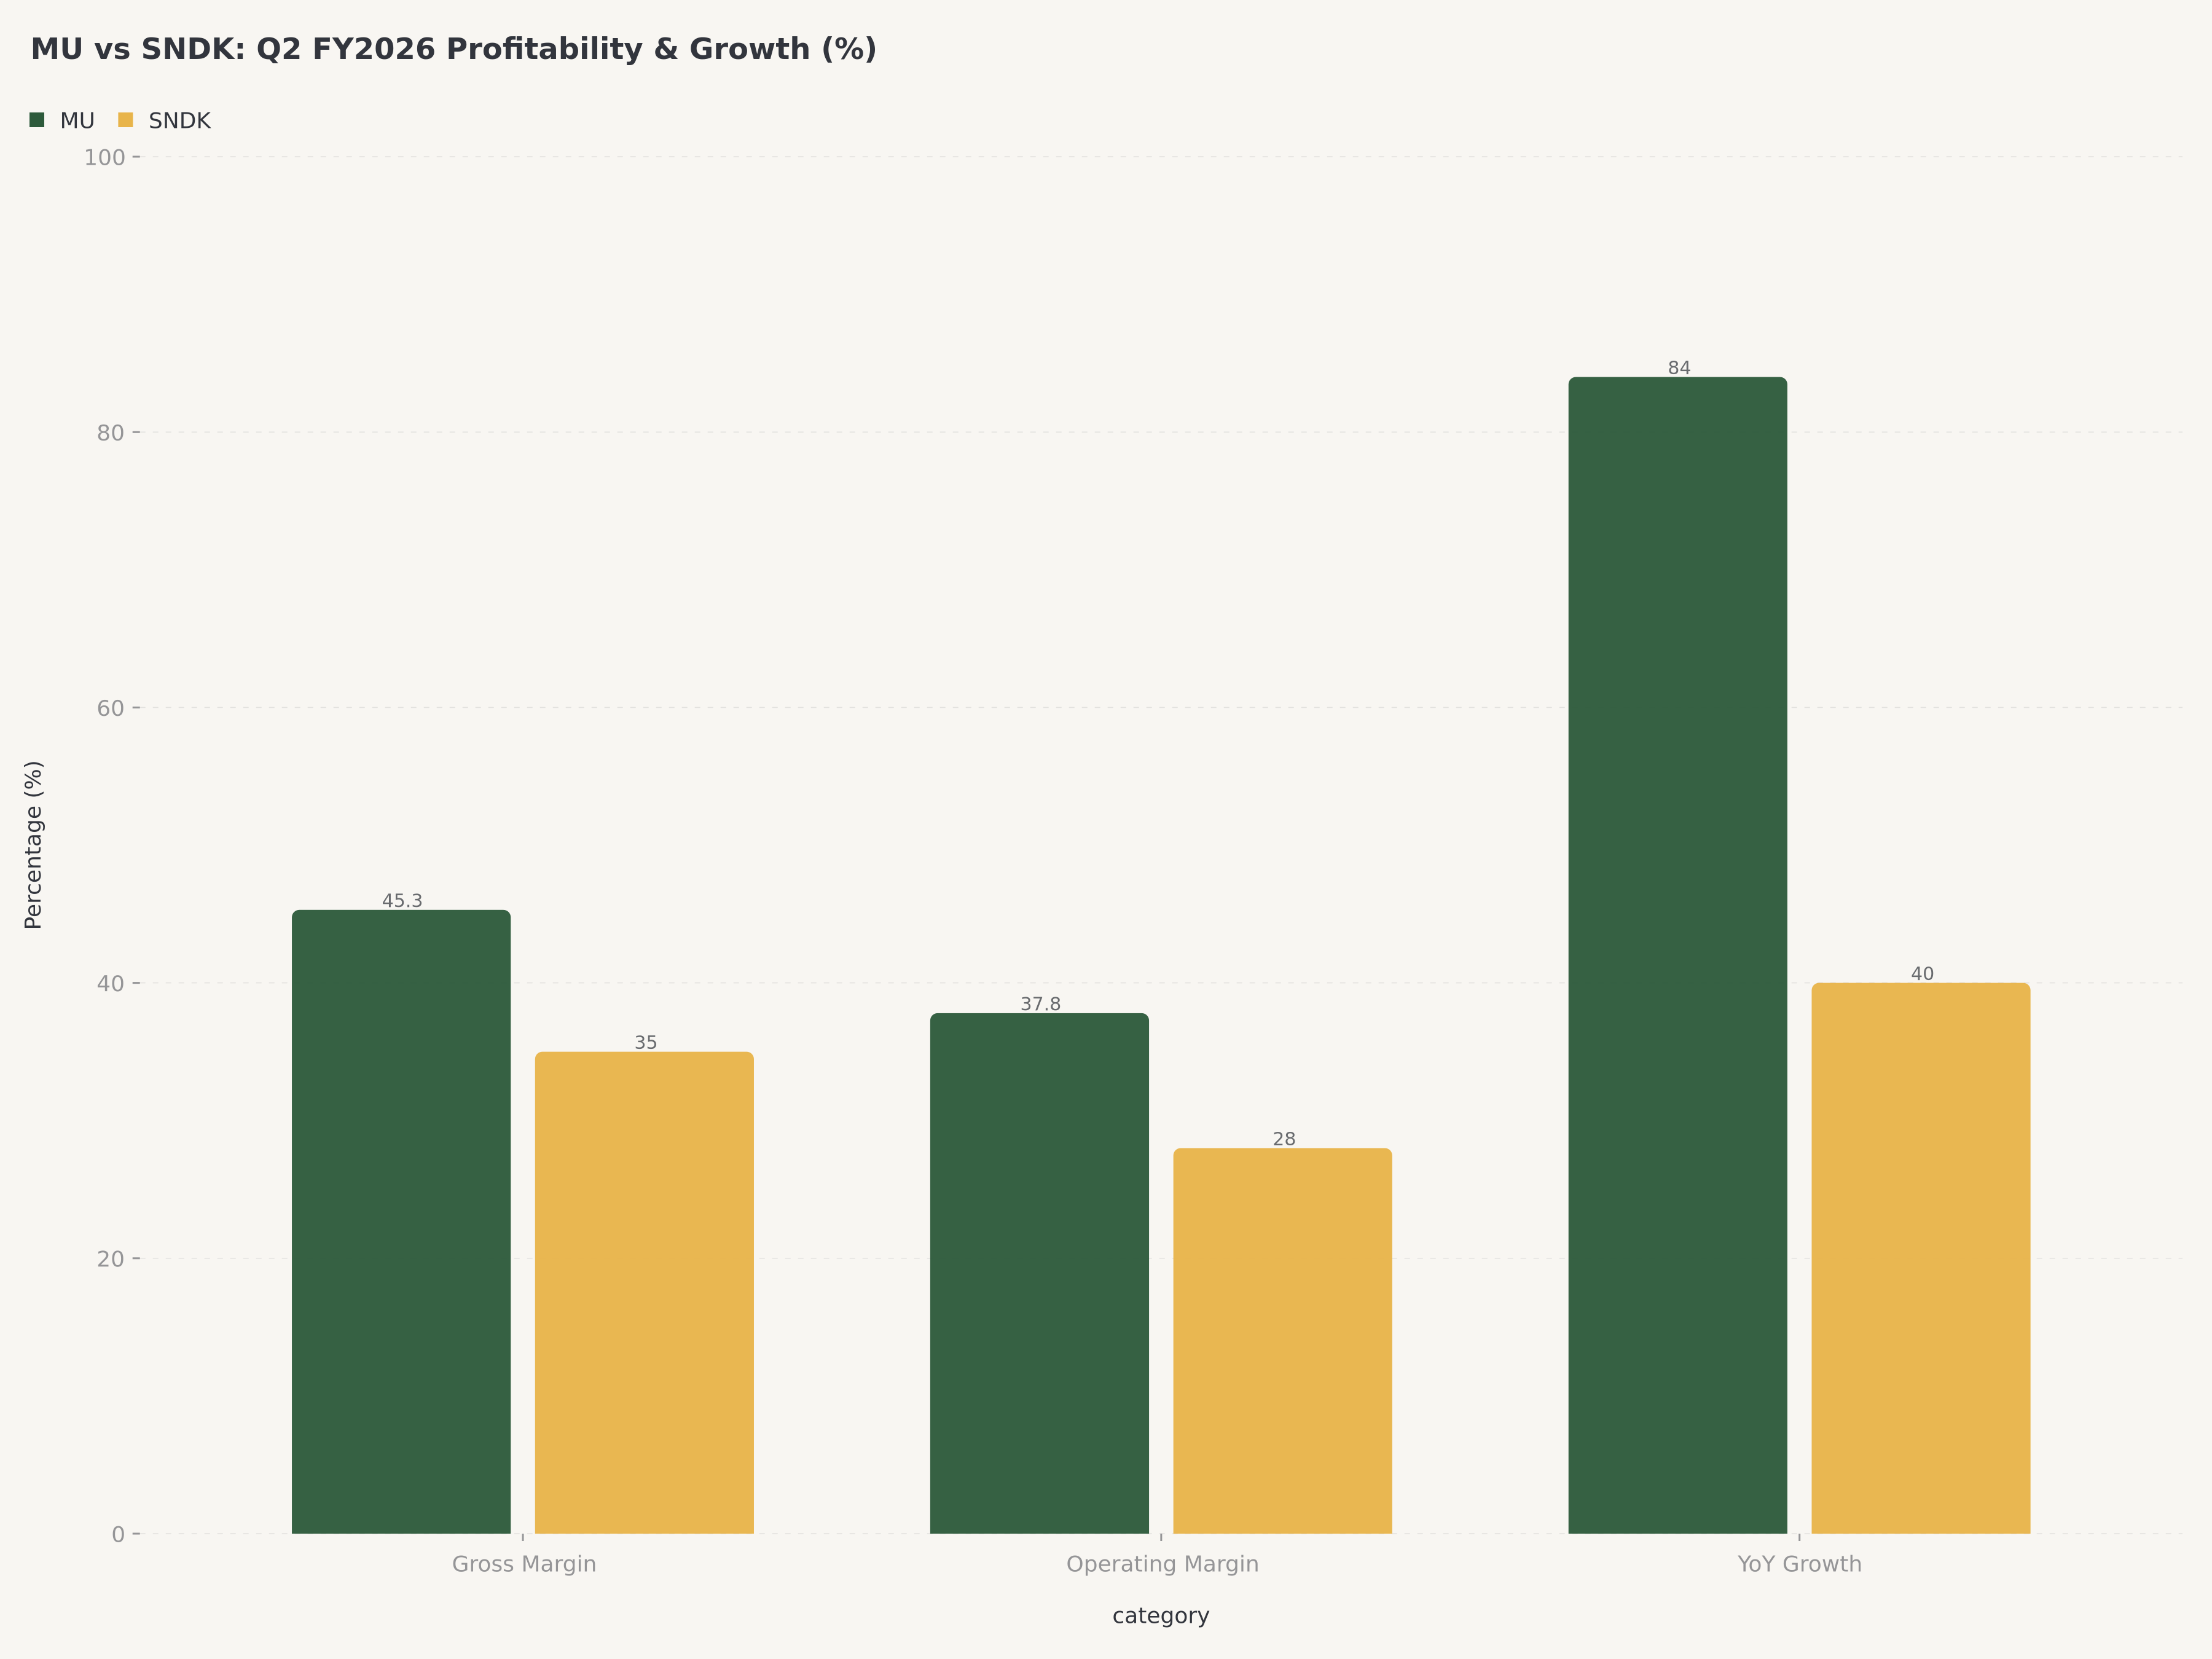
Q2 FY2026 利润率对比:MU 毛利率 45.3% vs SNDK 35%,营业利润率 MU 37.8% vs SNDK 28%
美光 vs 闪迪:Q2 FY2026 利润率特征对比。来源:公司财报、Edgen 360° 报告。

头对头财务摘要

规模差距很重要。美光 Q2 FY2026 营收 $12.1B 约为闪迪 $2.55B 的 4.7 倍。按年化运行率计算,美光是约 $500 亿营收公司;闪迪是约 $100 亿营收公司。美光毛利率显著更高(GAAP 45% vs Non-GAAP 35%——按会计方法调整后大致相当)。但闪迪的环比增长动能更大,无论是绝对值还是指引轨迹。
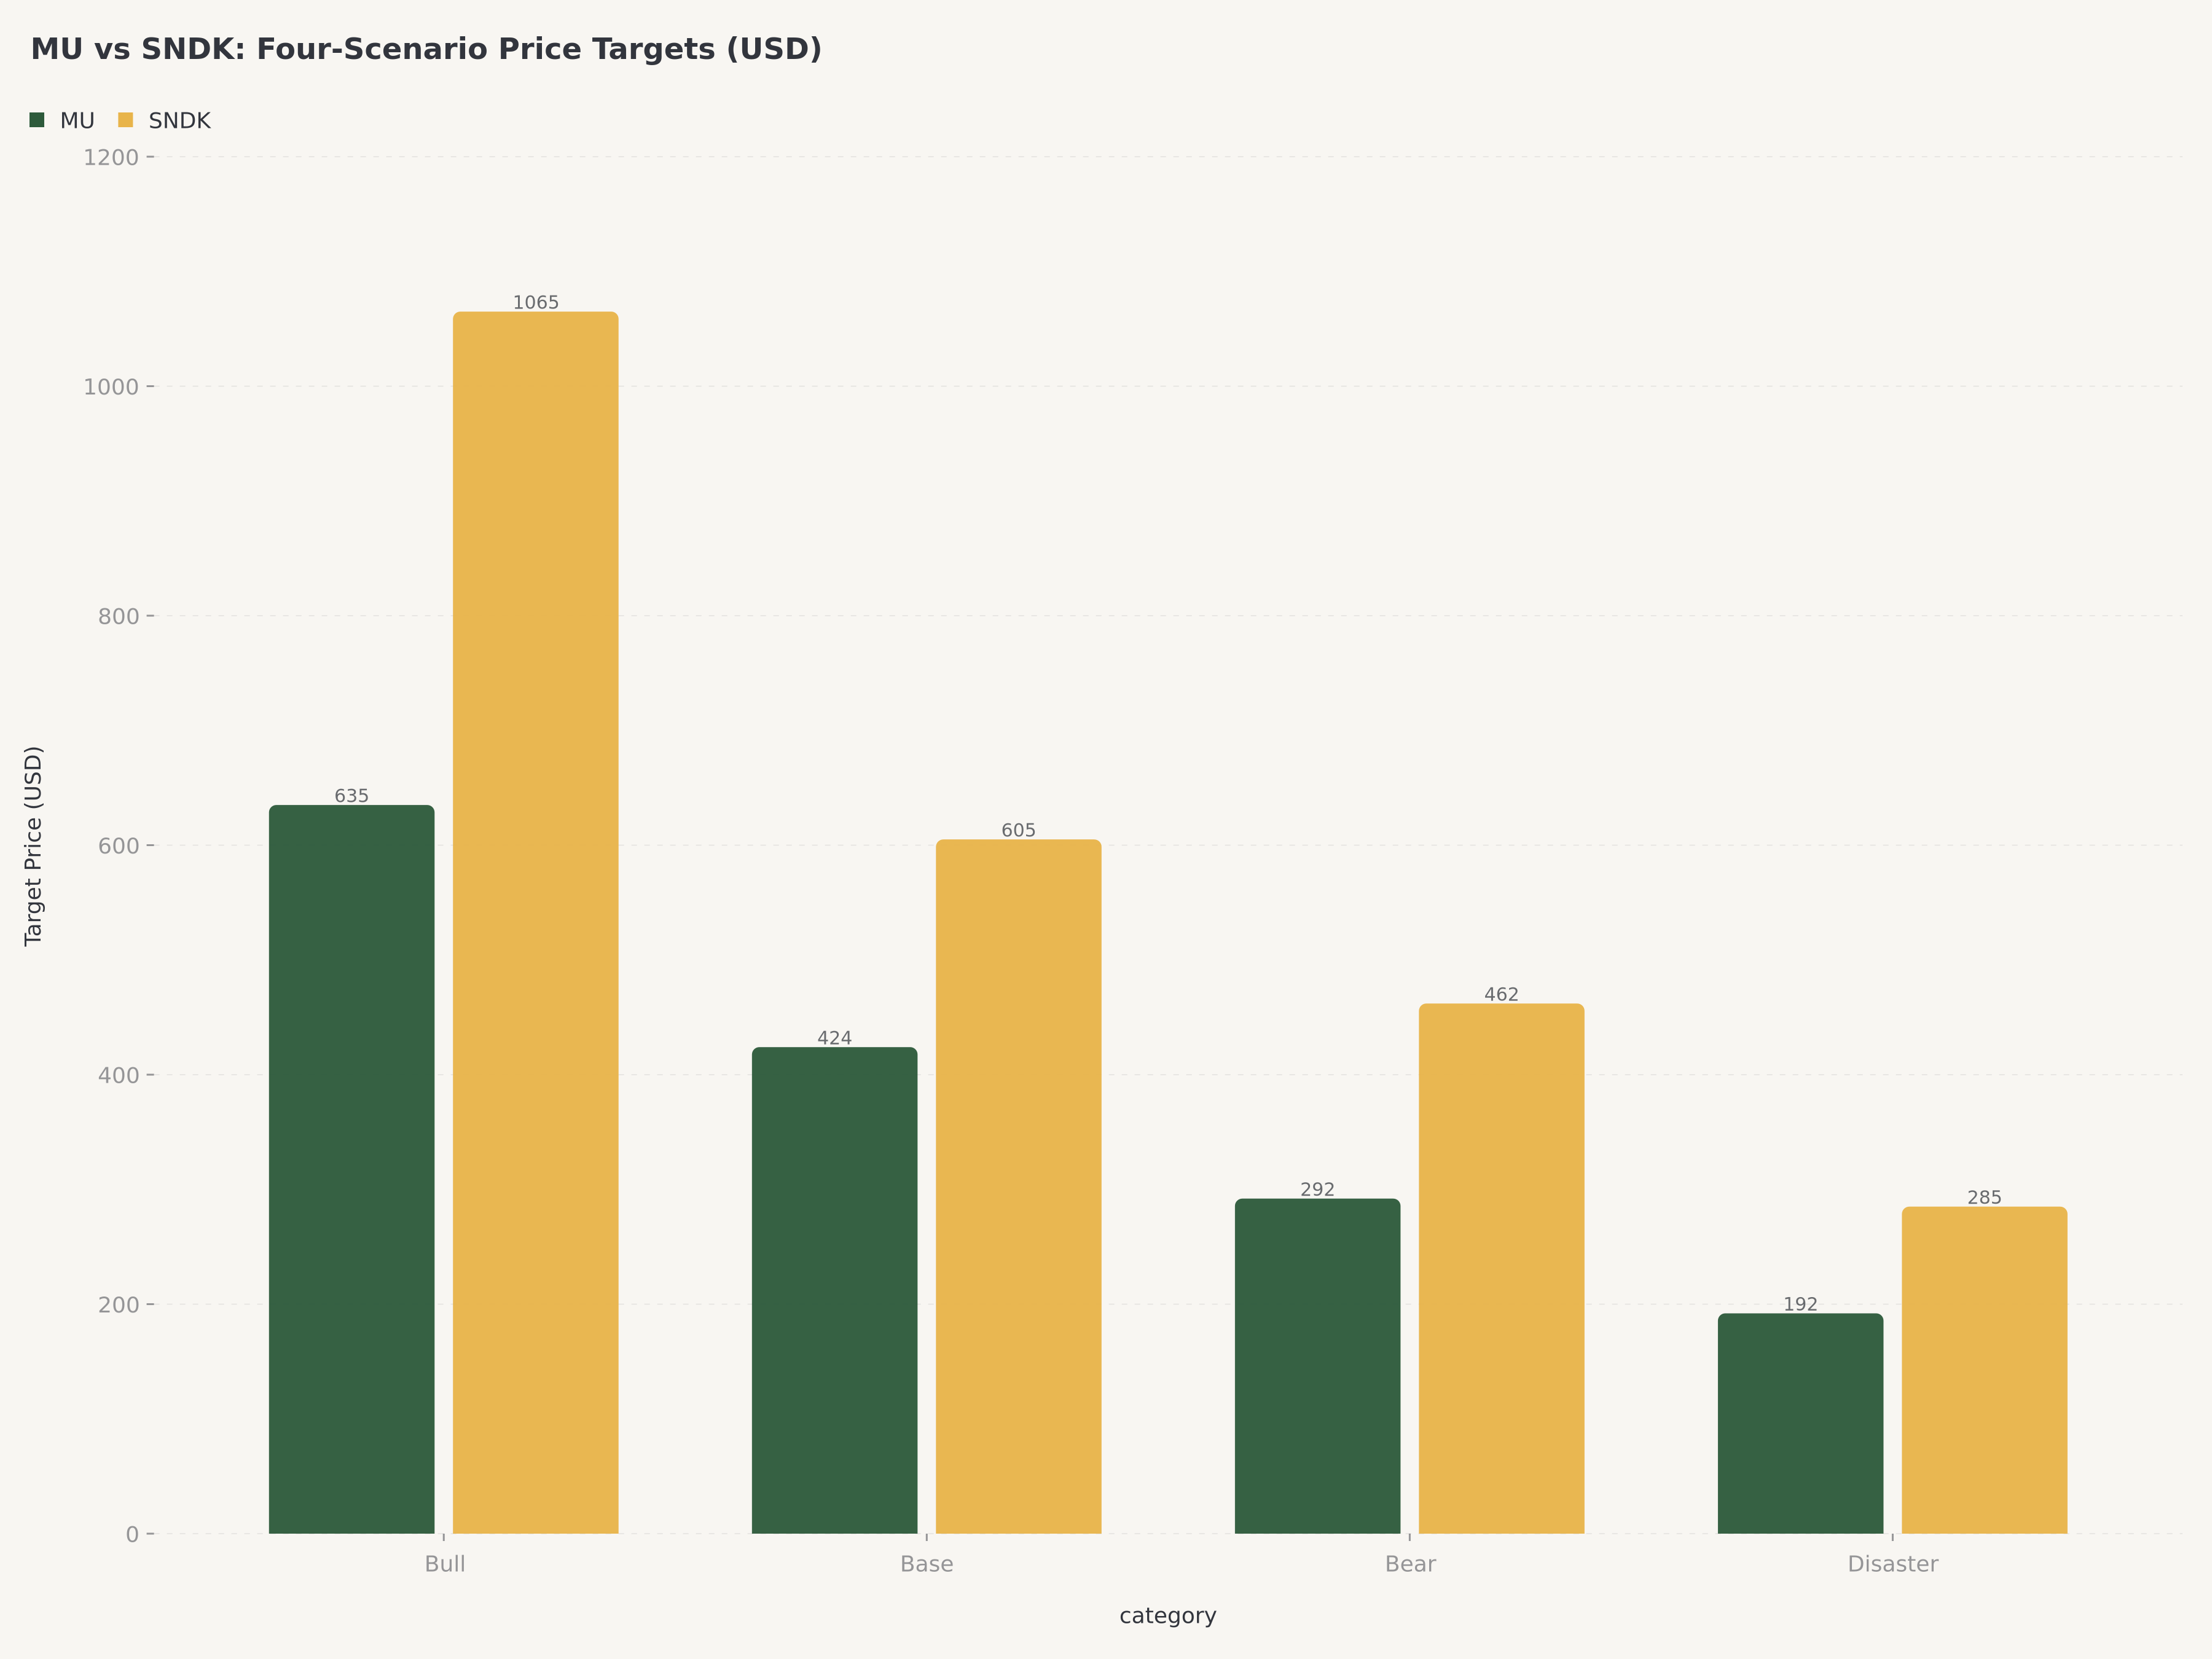
估值情景:MU 牛市 $635 (35%)、熊市 $292 (30%)、基准 $424 (20%)、灾难 $192 (15%);SNDK 牛市 $1065 (40%)、熊市 $462 (30%)、基准 $605 (15%)、灾难 $285 (15%)
美光 vs 闪迪:四情景估值模型对比。来源:Edgen 360° 报告。

估值差距:定价完美执行 vs 定价完美无瑕

这是对比文章变得具体之处。两家公司都在各自的 Edgen 360° 报告中提出了四情景估值模型。由此产生的概率加权公允价值计算得出截然不同的结论。

美光估值情景(来自 Edgen 360° 报告,2026 年 3 月 21 日)

情景

价格区间

市值区间

倍数

概率

牛市(强劲增长 + 有利宏观)

$605–665

$680–750B

1.50x–1.65x

35%

基准(疲弱增长 + 有利宏观)

$403–445

$450–500B

1.00x–1.10x

20%

熊市(强劲增长 + 不利宏观)

$262–322

$295–363B

0.65x–0.80x

30%

灾难(疲弱增长 + 不利宏观)

$161–222

$181–250B

0.40x–0.55x

15%

概率加权公允价值:约 $423。当前股价(2026 年 4 月 14 日):$465.66。市场目前对美光的定价比概率加权中心估计高约 10%,向牛市情景(牛市中点 $635 的约 +30-43%)的非对称上行尚未充分反映。牛市情景具体要求 HBM 执行——根据 Q2 FY2026 业绩和 Q3 指引,可以说已经在进行中。

闪迪估值情景(来自 Edgen 360° 报告,2026 年 4 月 12 日)

情景

价格区间

市值区间

倍数

概率

牛市(强劲增长 + 有利宏观)

$1,030–1,100

$152–162B

1.45x–1.55x

40%

基准(疲弱增长 + 有利宏观)

$570–640

$84–94B

0.80x–0.90x

15%

熊市(强劲增长 + 不利宏观)

$425–500

$63–74B

0.60x–0.70x

30%

灾难(疲弱增长 + 不利宏观)

$250–320

$37–47B

0.35x–0.45x

15%

概率加权公允价值:约 $698。当前股价(2026 年 4 月 14 日):$944.51。市场目前对闪迪的定价比概率加权中心估计高约 35%。牛市中点 $1,065 仅提供约 13% 的上行空间,而概率加权下行(熊市 + 灾难 = 合计 45% 概率)意味着 30-60% 的损失。当前价位的风险/回报与美光方向相反,呈非对称特征。

直白地讲:在今天的价格下,美光提供约 37% 牛市上行 vs 38% 熊市下行,按概率加权略偏向牛市结果的大致对称风险特征。闪迪提供约 13% 牛市上行 vs 45-55% 熊市/灾难下行,尽管 40% 牛市概率,按概率加权仍偏向下行的非对称风险特征。

差异化的 AI 故事:HBM 主导 vs NAND 加速

两家公司都是 AI 受益者,但通过不同的机制。

美光的 AI 敞口以 HBM 为中心,多年期可见。 每个 AI 加速器芯片——无论是 NVIDIA 的 Blackwell、AMD 的 MI350,还是来自谷歌、亚马逊或 Meta 的定制硅——都需要 HBM。2026 年加速器出货量预计将超过 800 万颗,每个加速器的 HBM 含量随每一代消耗更多容量而增长。美光自 2025 年中期以来已向 NVIDIA 批量出货 HBM3E,是仅有的两家供应最高端 AI 训练系统所用 12-Hi 36GB HBM3E 配置的供应商之一。HBM4 现在正在送样,将把这一领先地位延伸到 2027-2028。HBM 营收流的特征是:与超大规模客户的长期量化协议、多季度可见度,以及看起来更像特种化学品而非传统大宗内存的价格稳定性。

闪迪的 AI 敞口以 NAND-推理为邻并新兴。 闪迪的 AI 叙事建立在两个支柱上。第一,企业 SSD 用于 AI 推理工作负载的需求随着超大规模厂商部署更多容量来服务模型而加速。Q2 FY2026 数据中心分部 185% 的同比增长是具体证据。第二,BiCS10——与 NVIDIA 联合开发的 332 层 NAND 技术,计划于 2027 年量产爬坡——使闪迪受益于下一代 AI 优化存储。第三,也是最具投机性的,"高带宽闪存"(HBF)机会设想未来闪迪的最高密度 NAND 可以补充(或在某些情景下部分取代)HBM 用于 AI 推理应用。关键问题是其中有多少是基本面 vs 叙事:闪迪当前的 AI 营收真实且在增长,但 HBF 具体仍是 2027-2028 的潜力,而非 2026 的贡献者。

分析结论是:美光的 AI 敞口已验证、生产中且正在延伸;闪迪的 AI 敞口部分已验证(企业 SSD),部分仍是抱负(HBF)。
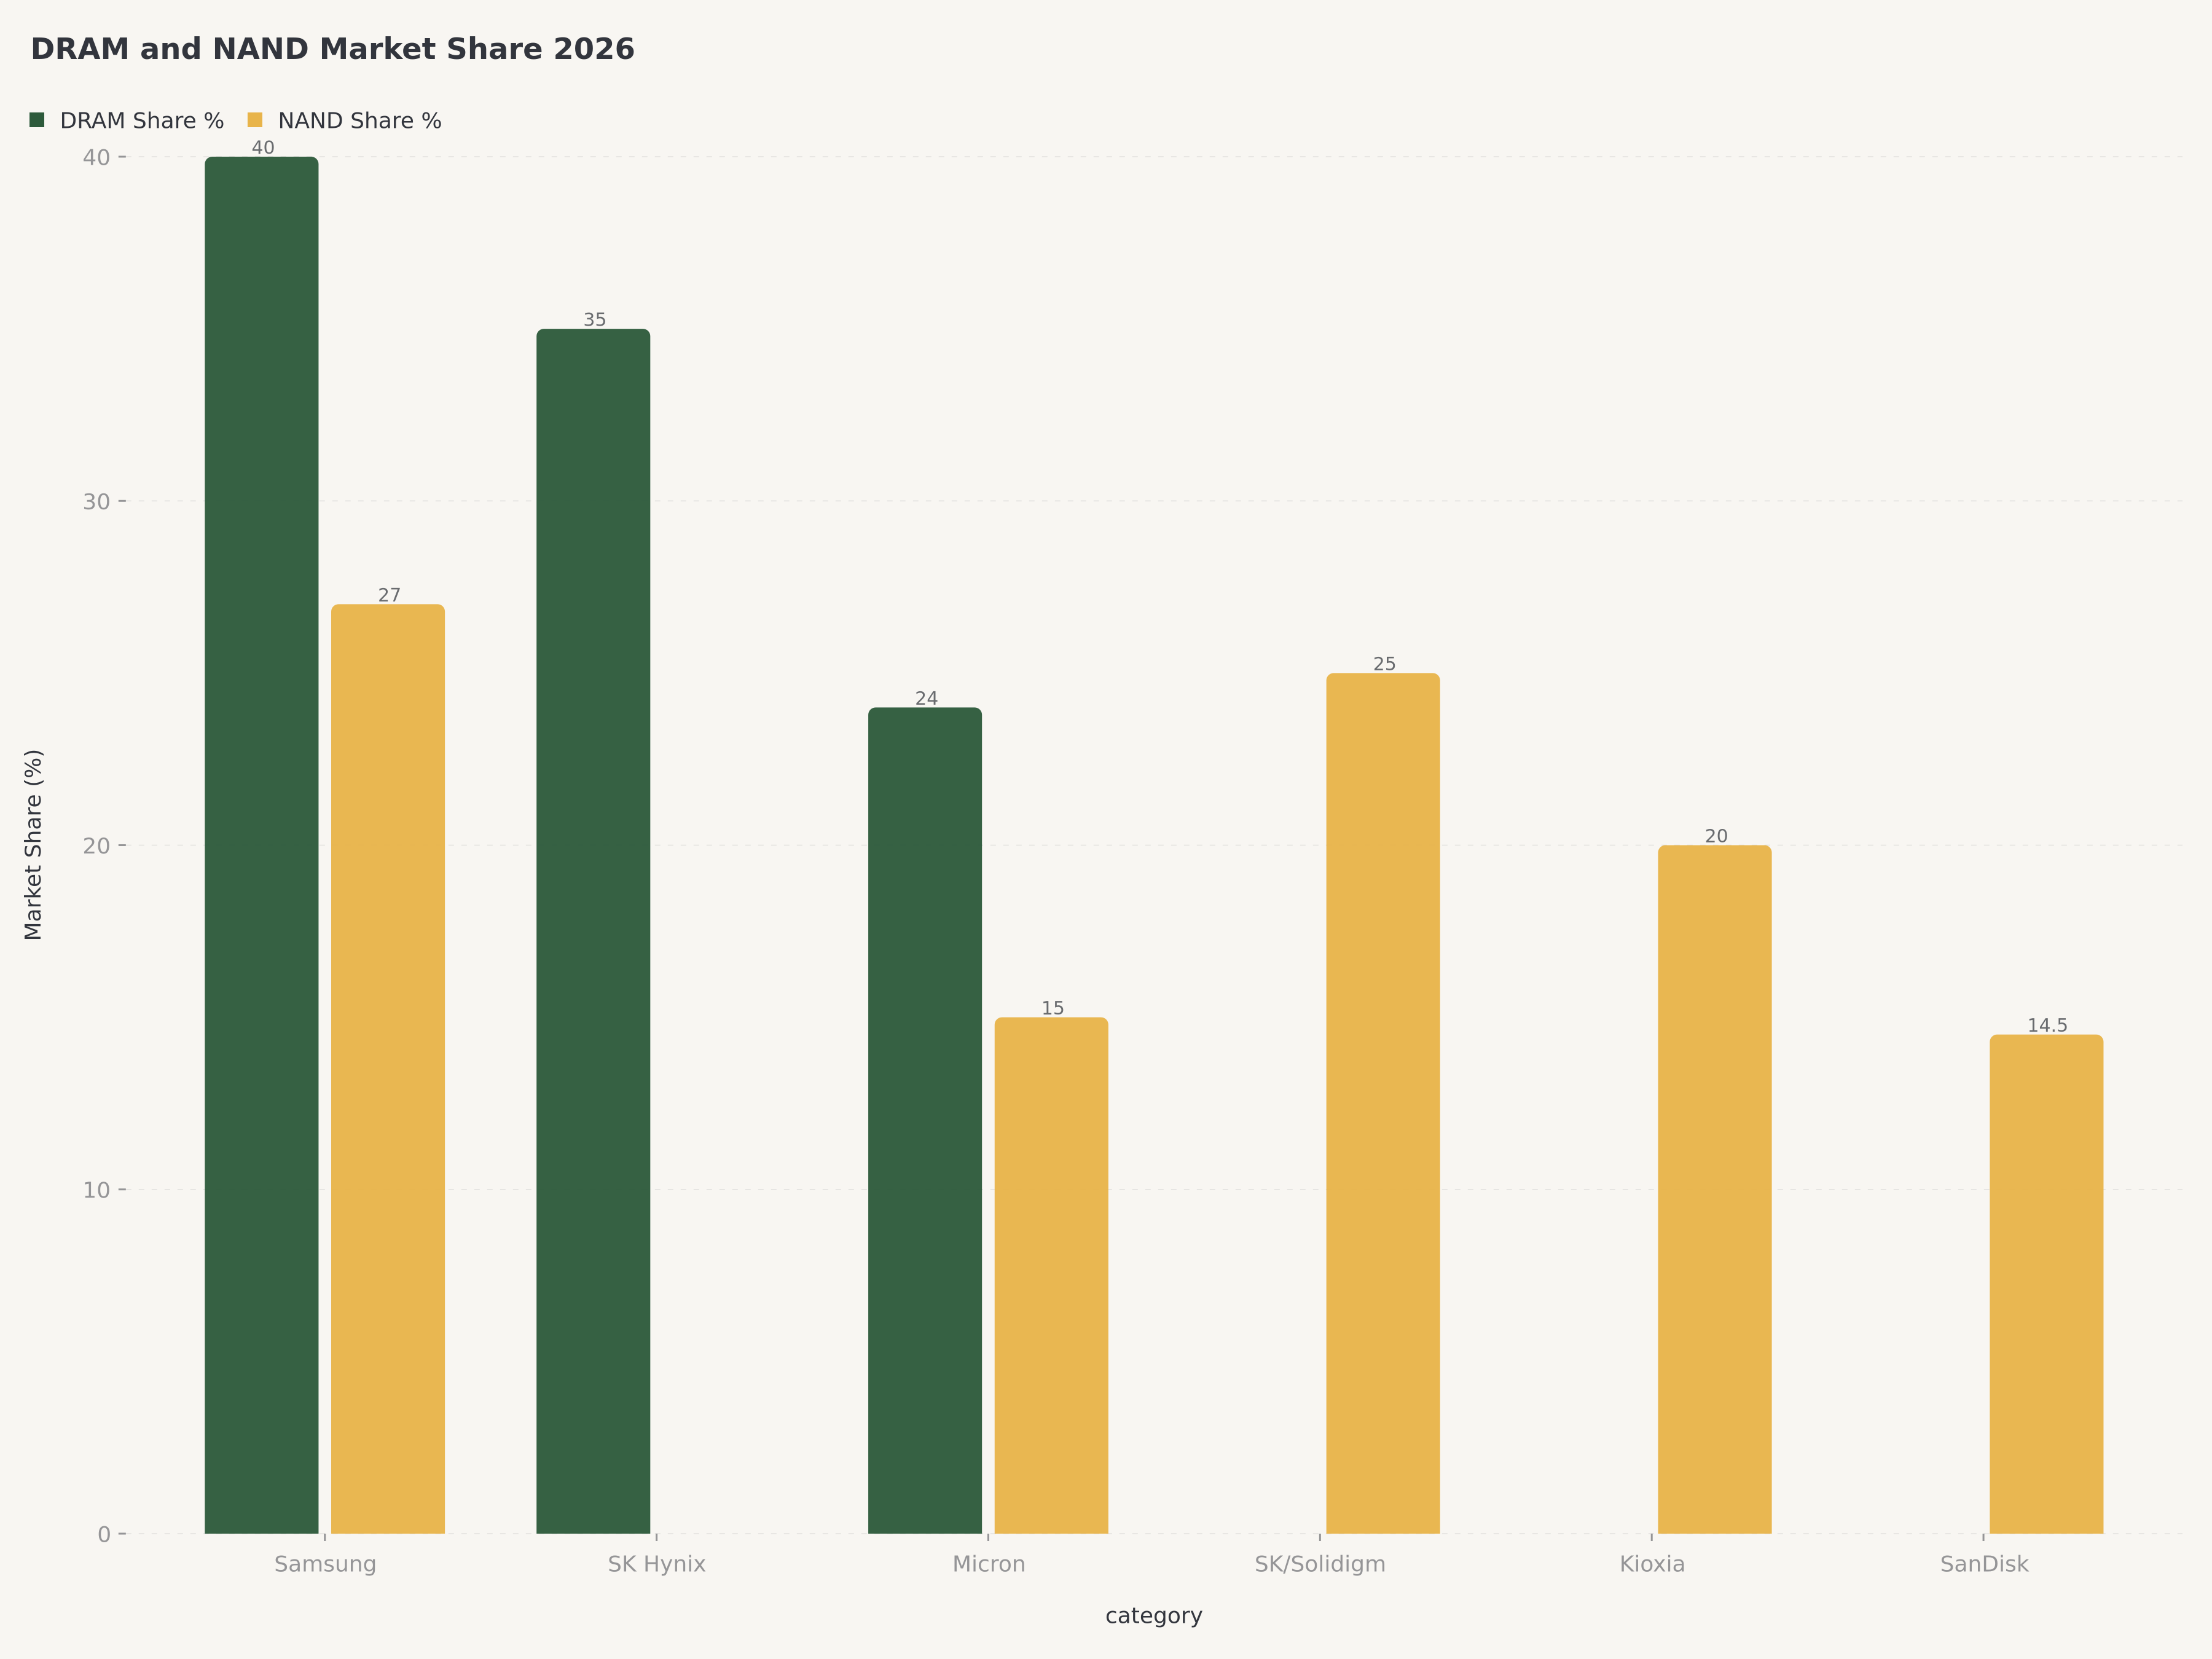
2026 内存市场份额:DRAM——三星 40%、SK 海力士 35%、美光 24%;NAND——三星 27%、SK/Solidigm 25%、铠侠 20%、美光 15%、闪迪 14.5%
2026 DRAM 与 NAND 市场份额——美光与闪迪所处位置。来源:Edgen 360° 报告、行业估计。

竞争定位:DRAM 寡头 vs NAND 大宗商品

内存行业的结构历来是公司盈利能力的主要决定因素,而美光和闪迪在其中占据非常不同的位置。

DRAM(美光的主要业务): 行业已整合至三大玩家——三星(约 40% 份额)、SK 海力士(约 35%)、美光(约 24%)。这 95%+ 的合计市场份额,加上巨大的进入壁垒(技术、资本要求、客户关系),历来在整个周期内产生高于平均水平的利润率。在 HBM 具体方面,SK 海力士目前领先(约 50% 份额),三星紧随(约 30%),美光积极爬坡至约 20%。美光在 HBM 份额上的轨迹是上行的,这很重要,因为 HBM 的毛利率比大宗 DRAM 高约 3-4 倍。

NAND(闪迪的主要业务): 行业有五大主要玩家——三星(约 27%)、SK 海力士/Solidigm(约 25%)、铠侠(约 20%)、美光(约 15%)和闪迪(约 14.5%)。竞争者数量更多、相对 DRAM 资本要求较低,以及更高的繁荣-萧条价格周期倾向,历来比 DRAM 产生更低且更波动的利润率。闪迪的第 5 位意味着它的定价权比三星或 SK 海力士低,必须通过技术(BiCS10)和合作伙伴关系(NVIDIA、铠侠)进行差异化以有效竞争。

HBM(AI 内存的皇冠明珠): 这是美光参与而闪迪不参与的领域。HBM 市场 2024 年约为 $180 亿,预计到 2029 年达到 $850 亿,根据行业估计毛利率为 55-65%。只有三家公司(SK 海力士、三星、美光)具有大规模制造 HBM 的技术能力。闪迪今天没有 HBM 业务,其 HBF 概念也不是真正的替代品——HBM 与 GPU 同封装,而 HBF 将在系统层面运行。

催化剂与风险

美光催化剂(近期)

  • 财年 Q3 FY2026 财报(2026 年 6 月)——可能在 $12.5B 营收指引上超预期,HBM 进一步上行
  • HBM4 量产爬坡公告(2026 年末)
  • B200 Blackwell 量产部署带动 HBM TAM 扩张
  • 第三个生产基地(台中)——$1.8B 投资,初始贡献预计在财年 2028

美光风险

  • 内存周期风险——尽管 AI 需求是结构性的,大宗 DRAM 和 NAND 仍可能供过于求
  • 地缘政治敞口——台湾设施、中国市场准入
  • HBM 供应链集中(HBM3E 先进封装产能受限)
  • 资本开支强度——财年 2025 $13.8B,财年 2026 上升至 $16-18B

闪迪催化剂(近期)

  • 纳入纳斯达克 100——2026 年 4 月 20 日(被动资金支持)
  • 财年 Q3 FY2026 财报(2026 年 4 月末)——在 $3.20-3.40B 指引上超预期
  • BiCS10 量产爬坡——预计 2027 年来自 NVIDIA 合作的初始营收
  • 潜在铠侠整合——12-24 个月时间表,可能创造定价权
  • HBF(高带宽闪存)针对 AI 推理的定位——2027-2028

闪迪风险

  • 在分拆后 2,228% 涨幅和 2026 年初至今 +301% 涨幅之后估值已被拉伸
  • NAND 供过于求风险——五玩家市场,历史上有快速价格恶化
  • BiCS10 执行风险——技术爬坡经常滑期
  • HBF 仅是抱负——实质性营收贡献最早在 2028+
  • 纳入纳斯达克 100 在当前价位已完全定价;事件可能是"卖出消息"
  • 客户集中——约 70% 的企业 SSD 营收来自前 10 大超大规模/OEM 客户

结论:买入 MU,持有 SNDK

美光(MU)— 买入,目标价 $550。 我们的目标价反映基准情景($424)和牛市情景($635)按 55%/45% 加权的混合,得出 $518,向上取整至 $550 以反映 HBM4 爬坡和 DRAM 价格持续走强带来的上行期权价值。在 $465.66,美光相对我们的目标价提供约 18% 上行空间,且风险特征大致对称。HBM 执行已被验证,Q3 FY2026 指引延伸了可见度,估值倍数(约 12 倍前瞻市盈率)对一家拥有结构性长期顺风的公司是合理的。仓位规模应反映美光本质上仍是周期性的——我们不建议在没有 AI 超级周期持续性的情况下作为核心仓位——但对于相信当前 AI 内存超级周期具有多年腿的投资者,美光提供最干净的敞口和最佳的风险调整回报特征。

闪迪(SNDK)— 持有,目标价 $750。 我们的目标价反映基准情景($605)和牛市情景($1,065)按 70%/30% 加权的混合,加上 5% 的纳斯达克 100 纳入被动资金支持溢价。这产生约 $760,取整至 $750。在 $944.51,闪迪交易在比我们目标价高约 20% 的位置。我们评级为持有而非卖出,因为(a)BiCS10 和 HBF 代表真实的期权价值,可能使股票重新评估更高,(b)纳入纳斯达克 100 将创造持久的被动需求,且(c)公司的 Q3 FY2026 指引可信。然而,我们不能建议在当前价位加仓。持有闪迪的投资者应考虑在股票超过 $1,000 时减仓,在 $800 以下会更具建设性。

我们观点的风险

美光买入观点的风险: 大宗 DRAM 或 NAND 价格的突然周期性下行——由 PC、智能手机或企业 IT 支出放缓驱动——将不成比例地压缩美光业务非 HBM 部分的利润率。如果 HBM 爬坡滑期或 NVIDIA 推迟 Blackwell 部署,美光 2026 年盈利轨迹可能令人失望。概率:25-30%,已反映在熊市情景中。

闪迪持有观点的风险: 我们持有观点的最大风险是我们过于谨慎。BiCS10 量产爬坡可能比 2027 年更早到来,HBF 可能在 2026 年末实现商业验证,NAND 价格可能持续走强超出预期。在此情景下,牛市概率应上调,股票可能在 2026 年向 $1,100-1,200 移动。相反,另一方向的最大风险是 NAND 供过于求回归——如 2023-2024 年——闪迪纯粹的 NAND 敞口将股票打回熊市情景的 $425-500 水平。

结语

美光和闪迪是表达对 AI 内存超级周期看多最干净的两个公开市场方式,但在当前价位它们不是等价投资。美光提供横跨 DRAM、NAND 和 HBM 的多元化敞口——其中 HBM 具体提供多年期可见度和利润率扩张,证明其溢价估值合理。闪迪提供集中、高 beta 的 NAND 敞口——具有真实的 AI 顺风但抱负型催化剂,且股价已经捕获了近期乐观情绪。

对于今天在内存复合体建立新仓位的投资者,我们以显著优势推荐美光高于闪迪。对于在分拆后涨幅之后已经做多闪迪的投资者,我们建议持有并密切关注执行——在 $1,000 以上减仓,在 $800 以下加仓。AI 内存超级周期是真实的、多年期的,且偏向具有 HBM 敞口的公司。美光拥有 HBM。闪迪没有(至少目前没有)。

FAQ

2026 年哪只内存股更好——MU 还是 SNDK?

美光(MU)在当前价位提供更好的风险调整回报。在 $465.66,美光交易在比其概率加权公允价值 $423 高约 10% 的位置,向其牛市情景 $635 的有意义的上行(35% 概率)。闪迪在 $944.51 交易在比其概率加权公允价值 $698 高约 35% 的位置,向其牛市情景 $1,065 的上行有限(40% 概率),但向其熊市情景 $462 有可观下行(45% 合计熊市+灾难概率)。我们评级 MU 买入,目标价 $550,SNDK 持有,目标价 $750。

什么是 HBM,为什么对美光重要?

高带宽内存(HBM)是一种专用的 3D 堆叠 DRAM 架构,提供比传统 DRAM 显著更高的内存带宽,使其对 NVIDIA H100、H200 和 Blackwell B200 等 AI 加速器芯片至关重要。美光是全球仅有的三家 HBM 制造商之一(另外是 SK 海力士和三星),HBM 的毛利率比大宗 DRAM 高约 3-4 倍。美光的 HBM 营收在 Q2 FY2026 增长至 $2.18B(环比 +22%),并指引在财年 2026 超过 $8B,CY2026 目标市场份额约 20%——高于 2025 年估计的 15%。

为什么闪迪股价 2026 年涨幅如此之大?

闪迪 2026 年初至今上涨约 301%(自 2025 年 2 月从 Western Digital 分拆以来上涨 2,228%),由多个因素组合驱动:(1) 强劲的 Q2 FY2026 业绩,营收 $2.55B(同比 +40%),(2) AI 驱动的企业数据中心 SSD 需求(数据中心分部同比增长 185%),(3) 围绕与 NVIDIA 联合开发的 BiCS10 332 层 NAND 技术的兴奋,(4) 关于"高带宽闪存"(HBF)机会可能挑战 HBM 用于 AI 推理的猜测,(5) 对 2026 年 4 月 20 日纳入纳斯达克 100 驱动被动指数资金的预期。

DRAM 和 NAND 有什么区别,哪个从 AI 中受益更多?

DRAM 是易失性内存(断电时丢失数据),用于短期处理器邻近存储——这是 HBM 作为专用高带宽变体所适合的位置。NAND 是非易失性闪存,用于 SSD 和移动设备的较长期存储。AI 训练工作负载需要大量 HBM(基于 DRAM)来向 GPU 计算馈送模型参数。AI 推理工作负载需要 HBM(运行模型)和 NAND SSD(存储模型权重和缓存结果)。目前,HBM 捕获了 AI 驱动利润率扩张的大部分,因为每个 AI 加速器消耗大量且增长的 HBM,而 NAND 通过企业 SSD 需求间接受益更多。美光从两者中受益;闪迪主要从 NAND 中受益。

什么会改变我们对 MU 的买入评级或对 SNDK 的持有评级?

我们将下调 MU 至持有,如果:(1) HBM 执行滑期,出货或市场份额低于指引,(2) 在 2026 日历 Q3-Q4 出现周期性内存下行,或 (3) 股票在没有相应盈利上行的情况下涨过 $600。我们将上调 SNDK 至买入,如果:(1) BiCS10 商业验证早于 2027 年时间表到来,(2) HBF 与超大规模厂商达成有意义的设计赢得,或 (3) 股票在没有基本面恶化的情况下显著回调(低于 $800)。

免责声明:本文仅供参考,不构成投资建议。作者和 Edgen 不持有所讨论证券的头寸。过去业绩并不代表未来结果。投资者在做出投资决定前应进行自己的尽职调查。

推荐阅读
banner.jpg

What is a money person? The plain-English alternative to a financial advisor

The short version: a money person is a smart, warm friend who happens to be good with money and explains it like a person, not a bank. Practically, it's a second opinion on your whole financial picture — cash, debt, tax exposure, concentration, and the goals you're working toward — that tells you in plain language what to look at first. It's not a traditional advisor managing your portfolio for 1% a year, and it's not a coach cheering you on. It's the honest read a good advisor's first meeting would give you, without the fee or the asset minimum. It's the role Ed Wealth was built to play. Strip away the label and a money person does four concrete things: Just as important is what it doesn't do: it doesn't take custody of your money, it doesn't sell you products for commission, and it doesn't pretend a forecast is a promise. It's a second opinion: it shows you the structure and lets you decide. People reach for four different things when they say "I should talk to someone." They're not
Edgen
·
Jul 10 2026
banner.jpg

Is a financial advisor worth it? Advisor vs robo vs money person

The short version: a financial advisor is worth it when your money has real complexity — a business, concentrated stock, an estate, a divorce, or turning savings into retirement income. There, a fee pays for itself. But most people don't have a complexity problem; they have a clarity one, and paying 1% of your assets a year — about $3,000 on a $300,000 portfolio, every year — is a lot to pay for reassurance. You have three tiers to choose from: a human advisor (~1% of assets), a robo-advisor (~0.25%), and a money person — a flat-fee second opinion that doesn't grow as your savings do. Start with the honest case for paying. A good advisor earns their fee when your situation is genuinely complex: selling a business, a big block of company stock or options, an estate with kids, a divorce, a windfall, or building a retirement-income plan with real moving parts. In those moments, one right call can save you many times the fee, and the job becomes picking a good one (that's how to choose a f
Edgen
·
Jul 10 2026
banner.jpg

Do You Actually Need a Financial Advisor? (An Honest Test)

The short version: you need a financial advisor when your money has genuine complexity — equity comp across several employers, a business sale, an estate with kids involved, a divorce, a sudden windfall, or a retirement-drawdown plan with real moving parts. If your situation is closer to "I earn well but somehow feel behind," that's a clarity problem, not a complexity one, and hiring someone to manage your money for about 1% a year is an expensive way to solve it. Here's how to tell which one you have. Almost everyone reaching for an advisor falls into one of two camps, and confusing them is where money gets wasted. A complexity problem is when there are real moving parts that interact: decisions where a wrong move costs far more than any fee. Selling a company, exercising stock options with a tax bill attached, splitting assets in a divorce, planning how to draw income across a 30-year retirement. Here, a good advisor earns their keep. A clarity problem looks different. Good income, a
Edgen
·
Jul 06 2026
banner.jpg

How to Choose a Financial Advisor in 2026 (and Whether You Even Need One)

The short version: picking a financial advisor isn't about finding the "smartest" one. It comes down to three boring questions that actually predict whether you'll be treated well: are they legally a fiduciary, how do they get paid, and do you even need one yet. Get those right and the rest is noise. Here's how to run the check — and what to do if you want guidance but can't (or don't want to) meet a $250,000 minimum. Before you choose one, ask whether this is the right tool at all. A full-service advisor earns their fee when your situation is genuinely complex — a business sale, equity comp across several companies, estate planning, a divorce, a sudden windfall, or a retirement-income plan with real moving parts. But a lot of people reaching for an advisor don't have a complexity problem. They have a clarity problem: a good income, a few scattered accounts, and a nagging sense of being behind. That doesn't need someone to manage your money for 1% a year. It needs a clear read on where
Edgen
·
Jul 06 2026
Redeem miles for gift cards and each is worth ~1 cent; redeem for long-haul business and they're worth 2.5-4+. With programs now dynamically priced, the one check that decides every redemption.

How to redeem airline miles without wasting them

The single biggest mistake with miles is redeeming them for the easy stuff: gift cards, merchandise, seat upgrades at the gate. Do that and each mile is worth about one cent. Redeem the *same* miles for flights, especially long-haul or premium-cabin flights, and they're often worth two to five cents each, sometimes more. So the real skill isn't earning miles; it's not throwing away their value at the finish line. Here's how to actually use them. A mile has no fixed price; its value depends entirely on what you redeem it for. The way to judge any redemption is simple math: (cash price of the flight) ÷ (miles it costs) = cents per mile. If a flight costs $400 or 20,000 miles, that's 2 cents a mile, a solid deal. If a $90 flight costs 18,000 miles, that's half a cent, which is terrible; pay cash and keep the miles. Run this check before every redemption. It instantly separates a great use from a waste, and it's the one habit that makes miles worth having. As a rule of thumb, most major ai
Edgen
·
Jun 30 2026
Short-term goals (under ~3 years) belong in safe cash; long-term goals (5+ years) can take market risk. The best HYSAs now pay ~4-5% APY. How to sort yours and run both.

Long-term vs short-term financial goals (and how to plan both)

The difference comes down to one thing: time. A short-term goal is money you'll need within roughly three years (an emergency fund, a trip, a wedding, next year's tax bill), so it has to be *safe and reachable*. A long-term goal is five-plus years out (retirement, a house down the road, a kid's education), so it can take market risk, because time smooths the bumps out. Get that match right and you've done most of the work. It's not the size, it's the deadline. A $2,000 goal you need in six months is short-term; a $2,000 goal you won't touch for fifteen years is long-term, and they belong in completely different places. This is the part that actually matters, and where people lose money without realizing it. Short-term money should not be in the stock market. If your emergency fund is in stocks and the market drops 20% the same month your car dies, you're selling at the worst possible time. Short-term goals go somewhere stable and accessible, and a high-yield savings account is the clas
Edgen
·
Jun 30 2026
Mortgages near 6.5%, home prices flat, and the Fed split on rate cuts vs hikes. With timing a coin flip, the 3 questions that actually decide whether to buy now or wait.

Should you buy a house now or wait? How to actually decide

The honest answer: buy when you'll stay put for at least five years and you'll still have an emergency fund left after the down payment. Otherwise, waiting (and renting) is often the smarter money move, not the weaker one. "Rent vs buy" isn't a math problem with one right answer, and it's almost never really about timing the market. It's about your *life*, in three questions. Before the three questions, here's the mid-2026 backdrop — because "now or wait" usually hides a bet on rates and prices, and the data says that bet is a coin flip. The picture: mortgages are still pricey, prices have gone flat (more than half of the 20 big metros saw year-over-year declines in March), and the cheap-money era hasn't returned. So "buy before it runs away" and "wait for the crash" are *both* weak arguments right now. The whole "wait for rates to drop" plan rests on the Fed, and the Fed is split down the middle. In its June 2026 projections, policymakers were divided: 8 expected no change this year,
Edgen
·
Jun 30 2026
Most financial goals fail because they're wishes, not systems. Here's the 3-part anatomy of a goal that sticks (a number, a date, one automatic move), plus why 37% of adults can't cover a $400 surprise.

How to set financial goals you'll actually hit

A financial goal you'll actually hit has three things a vague wish doesn't: a number, a date, and one automatic move that happens whether or not you remember it. "Save more" is a wish. "$6,000 in a separate account by next December, $500 auto-transferred on payday" is a goal. The gap between those two sentences is the reason most goals quietly die, and it has almost nothing to do with willpower. Key Takeaways A real financial goal answers three questions: how much, by when, and what for. Drop any one and it stops working. "Pay off debt" has no number and no date, so there's nothing to aim at or measure, while "$8,000 of card debt cleared in 18 months" tells you exactly whether you're on track and the day you're done. The "what for" matters more than people expect. A goal tied to something real (a buffer so a bad month isn't a crisis, a deposit on a first place) survives the months when motivation dips. In our experience reading how people actually use a money tool, the goals that get
Edgen
·
Jun 30 2026
A big RSU grant just vested — now what? Here's what a modern money tool actually surfaces first, using Ed as a worked example: a reality check, the 22% tax gap most high earners miss, and the concentration risk nobody flags.

Your RSUs Just Vested. Here's What a Money Tool Surfaces First.

You just had a big RSU grant vest. Congratulations — and now the awkward part: a six-figure pile of your own company's stock, a vague sense you should "do something," and no one actually telling you what. An advisor, a spreadsheet, and a piece of software each handle this moment differently. Here's what a modern money tool surfaces in a moment like this — using Ed as a worked example — so you can decide what kind of help actually fits. Key takeaways You connect your brokerage and bank through read-only aggregation, so the tool can read balances but can't move a dollar. Ed's framing is simple: precise about your money, blind to your identity. Instead of sorting your lattes into categories, Ed opens on a single Financial Reality Check — a read on whether your money could survive a bad month. For a lot of high earners, that one number lands harder than any budget, because it answers a question the other apps never ask. (If the Reality Check is the numbers side, your money type is the beha
Edgen
·
Jun 26 2026
A money personality test is more than a quiz if it measures behavior, not just vibes. Here's the science behind money types, how Ed's test works, and how to use your result.

What Is a Money Personality Test? The Science Behind Your Money Type

The short version: a good money personality test should feel like a roast and work like a mirror — fun on the surface, behavioral underneath. The useful ones don't tell you what you know; they show you how you act with money, and the one blind spot worth watching. Key takeaways Here's the uncomfortable backdrop. U.S. financial literacy has been stuck for a decade — adults answer only about 49% of the standard knowledge questions correctly, essentially flat since 2017 (TIAA Institute–GFLEC, 2025) — even as free financial information became infinite. If facts fixed money, they'd have fixed it by now. They don't, because the thing that actually drives your outcomes lives one level below the facts: how you're wired to behave when money is on the line. That's the whole premise of financial fitness — and it's what a money personality test is built to surface. Not what you know. What you do. The idea has real research behind it — money behavior is patterned and measurable, and a few tradition
Edgen
·
Jun 23 2026

投资这事,终于不用一个人了

免费试用 Edgen。不用信用卡,不绑约